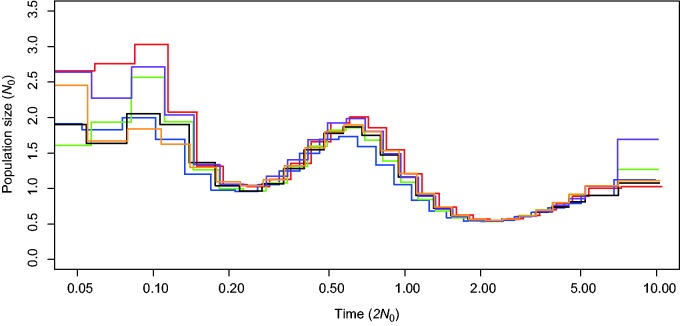
Fig. 3.—
The change in population size inferred by PSMC. Six individuals, MCM1–MCM6, are labeled by red, blue, green, black, purple, and orange lines, respectively. The time from the present and effective population size are shown in the x- and y-axes, respectively. Note that the time and the size were arbitrarily scaled by baseline effective population size (N0) equal to 10,000 (see Results and Discussion).

