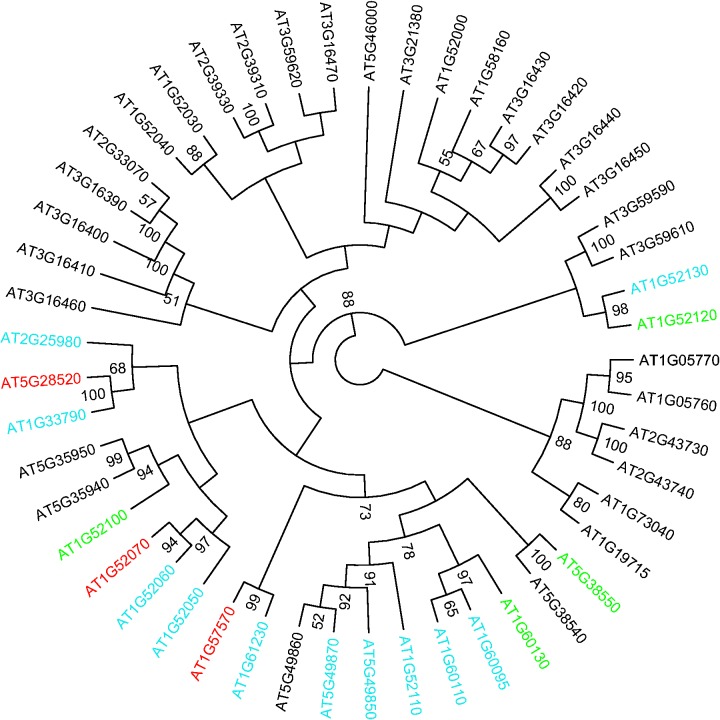
Fig. 3.—
Phylogenetic analysis reveals dynamic evolution of miRNA regulation in jacalin family genes in Arabidopsis thaliana. Maximum-likelihood analysis was performed using RAxML. WAG+G+F+I was chosen as the most suitable substitution model based on the result of ProtTest before the phylogenetic reconstruction. Gene symbols with the color of green, blue, and red indicate targeting by miR842, miR846, and both miRNAs, respectively. Numbers next to the nodes correspond to bootstrap values obtained from 1,000 bootstrap replicates. Only the nodes with bootstrap values greater than or equal to 50 are shown in the tree.

