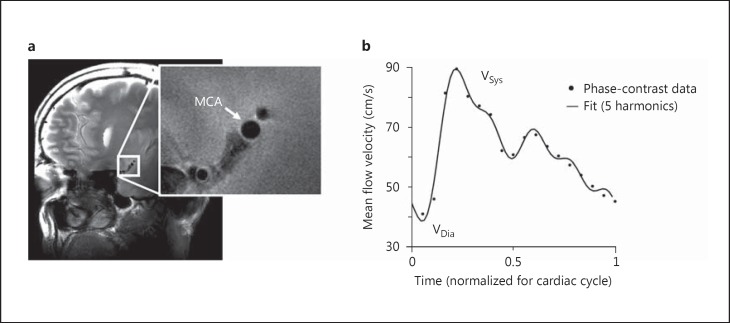
Fig. 1.
a Example of T2-weighted high-resolution structural image of the cross-sectional area of the M1 segment of the MCA. b Example of phase-contrast flow velocity data (dots) measured at the same location as in a. The flow velocity waveform was approximated by fitting the first five harmonics of a Fourier sequence (solid line), from which the pulsatility index was calculated. Sys = Systole; Dia = diastole.

