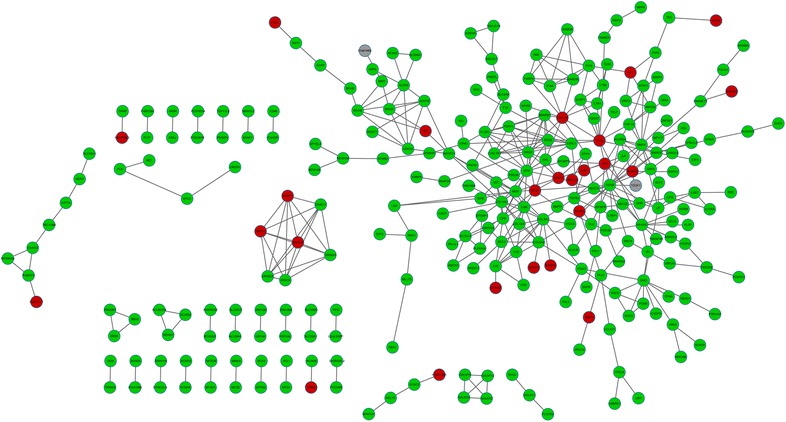
Fig. 1.

Protein–protein interaction network of the selected differentially expressed genes (DEGs). Red circle stands for the up-regulated genes while green circle stands for the down-regulated genes. Gray circle stands for the non-differentially expressed genes. Edge stands for the interaction between two genes
