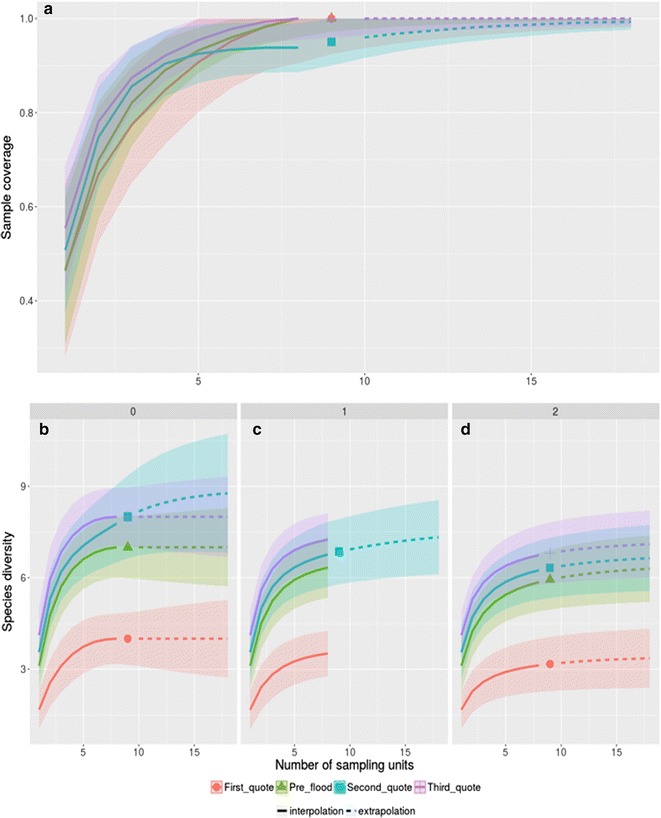
Fig. 1.

a Coverage-based rarefaction (solid line) and extrapolation (dashed line) plots with 95% CI during the four different flooding stages of UHE Jirau. Sample-units-based rarefaction (solid line) and extrapolation (dashed line) plots with 95% CI for Anopheles species during the four different flooding stages of UHE Jirau for species richness (b), the exponential Shannon index (c), and the inverse of the Simpson diversity index (d)
