Fig. 1.

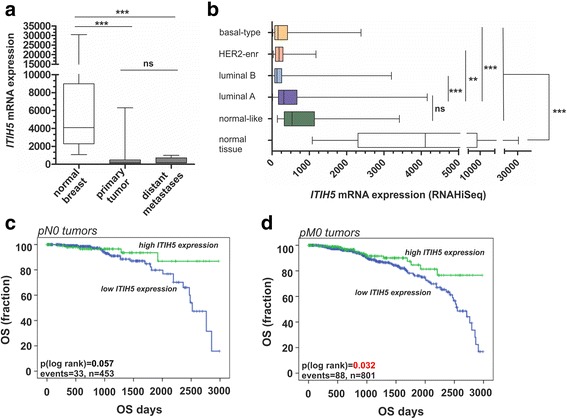
ITIH5 expression loss in breast cancer subtypes and distant metastases. a-b Illustration of ITIH5 mRNA expression based on the TCGA data portal. a Box plot demonstrating a significant loss of ITIH5 mRNA expression in primary breast tumors and distant metastases derived from primary breast tumors, ns: not significant, ***p < 0.001. b Breast tumor samples stratified by subtypes [28], ns: not significant, **p < 0.01; ***p < 0.001. c-d Kaplan-Meier analyses display OS of nodal-negative (pN0, c) and non-metastatic (pM0, d) breast cancer patients stratified by high ITIH5 (green curve) and low/intermediate ITIH5 mRNA expression (blue curve)
