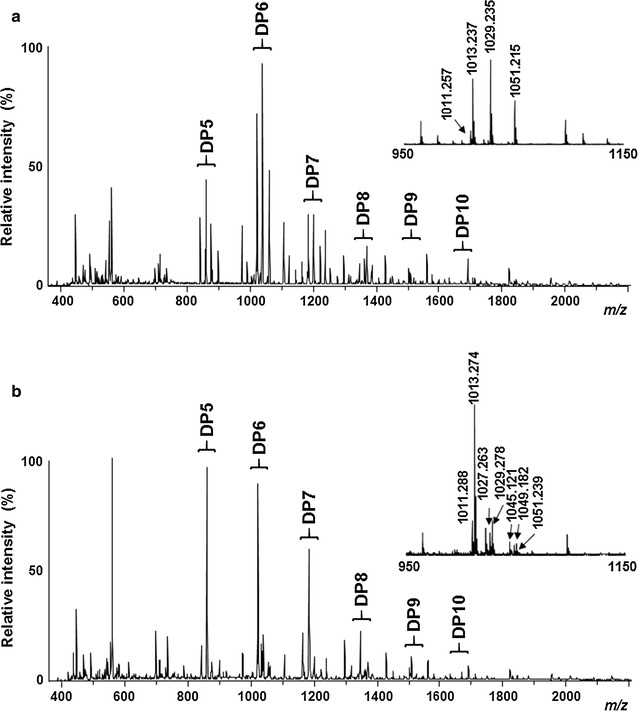
Fig. 1.

Product analysis obtained from the incubation of cellulose with TtAA9E or TaAA9A using MALDI-TOF/TOF MS. Avicel (5%, w/v) was incubated with TtAA9E or TaAA9A (1 mg/g Avicel) in 50 mM sodium acetate (pH 5.0) with 10 mM of ascorbic acid at 50 °C for 4 days. Overall profiles of products with sodium saturation generated from the incubation of cellulose with a TtAA9E or b TaAA9A in the presence of 10 mM ascorbic acid. Insets are expanded mass spectra for DP6 products obtained from the incubation of cellulose with a TtAA9E or b TaAA9A. 100% relative intensity represents 3.31 × 10⁴ and 2.62 × 10⁴ arbitrary units (a.u.) for the full spectra of TtAA9E and TaAA9A, respectively, and 3.31 × 10⁴ and 2.24 × 10⁴ a.u. for the close-up peaks of DP6 for TtAA9E and TaAA9A, respectively
