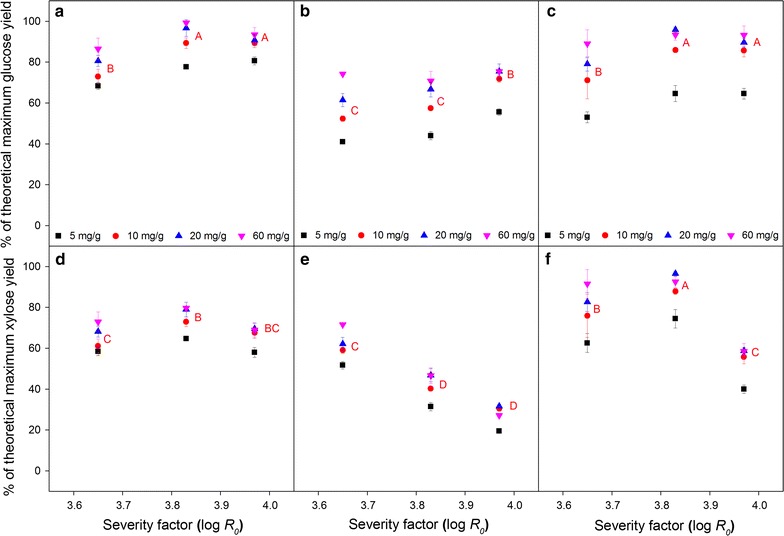
Fig. 2.

Glucose (a–c) and xylose (d–f) release after 72 h enzymatic hydrolysis of hydrothermally pretreated (a, d) corn stover (CS), (b, e) Miscanthus × giganteus stalks (MS), and (c, f) wheat straw (WS) at different severity factors (log R 0) and enzyme dosages (mg/g). Data points represent average and standard deviation from three experimental replicates. Different letters indicate significant statistical difference based on ANOVA (p ≤ 0.05) for 10 mg/g enzyme dosage series
