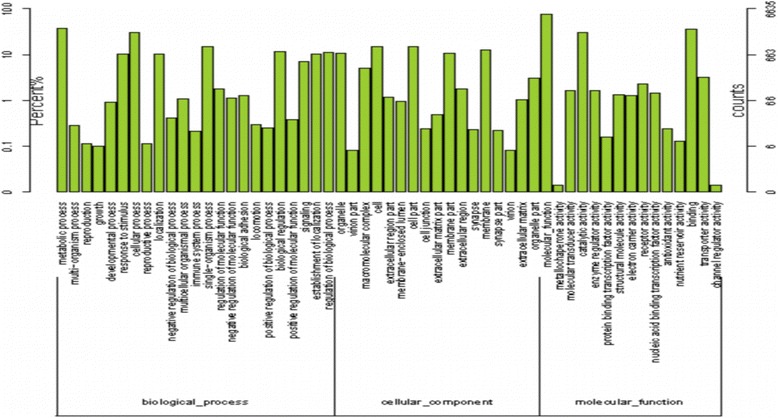
Fig. 2.

Gene Ontology analysis of hepatopancreas transcriptome data. The results are summarized for the three main GO categories; red bars refer to “biological process”, blue bars refer to “cellular component” and green bars refer to “molecular function”. The Y axis shows the number of unigenes in each category
