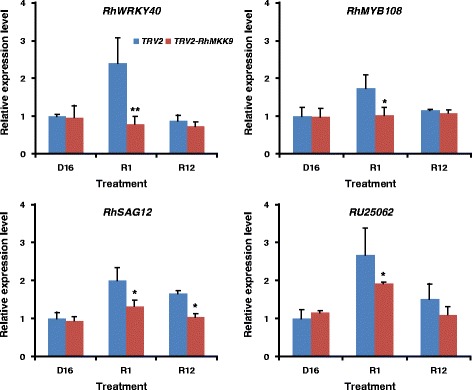
Fig. 5.

Expression patterns of four ethylene-responsive genes in petals of TRV control and RhMKK9-silenced flowers. At least three biological replicates were tested for each time point. Asterisks in the bottom panel indicate significant differences calculated using the t test (**p < 0.01, *p < 0.05). D16, dehydration for 16 h; R1 and R12, rehydration for 1 h and 12 h, respectively
