
Fig. 3.
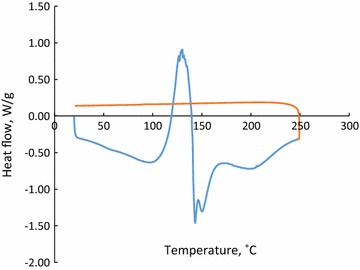
The DSC analysis of precipitates produced via acidifying of sample 1; hydrolysis at 170 °C, 15 min; blue curve shows heating vs. red curve which shows cooling
Official websites use .gov
A
.gov website belongs to an official
government organization in the United States.
Secure .gov websites use HTTPS
A lock (
) or https:// means you've safely
connected to the .gov website. Share sensitive
information only on official, secure websites.
The DSC analysis of precipitates produced via acidifying of sample 1; hydrolysis at 170 °C, 15 min; blue curve shows heating vs. red curve which shows cooling