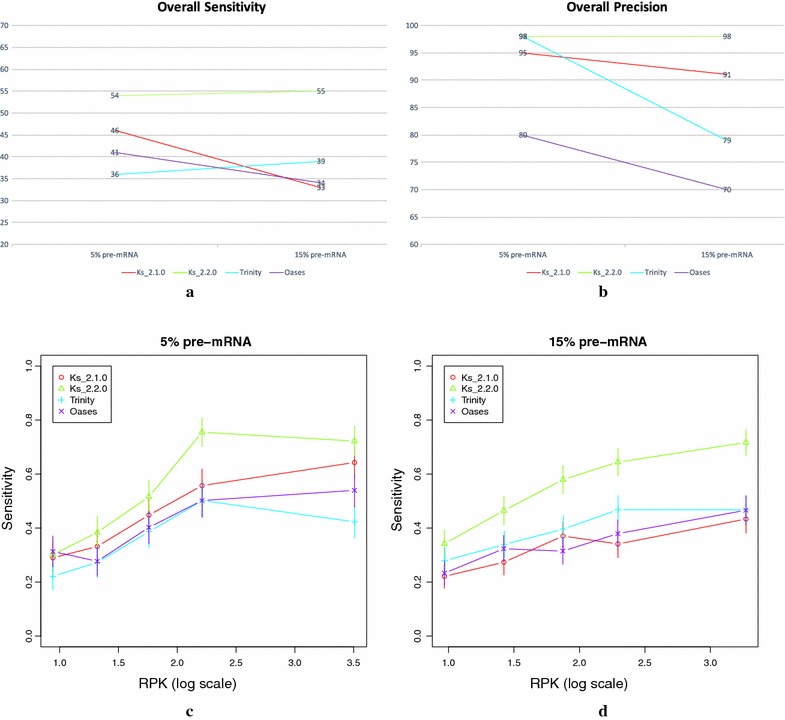
Fig. 7.

The overall values for sensitivity and precision, and the detailed sensitivity by expression levels of Ks_2.1.0, Ks_2.2.0, Trinity and Oases on the two simulated datasets. a Overall sensitivity of the four methods on the two simulated datasets. b Overall precision of the four methods on the two simulated datasets. c Detailed sensitivity by expression levels of the four methods on the 5% pre-mRNA dataset. d Detailed sensitivity by expression levels of the four methods on the 15% pre-mRNA dataset. The expression levels in c and d represent several classes of expression of the minor isoform. Each class (i.e. point in the graph) contains the same number of AS events. It is therefore an average sensitivity on a potentially broad class of expression
