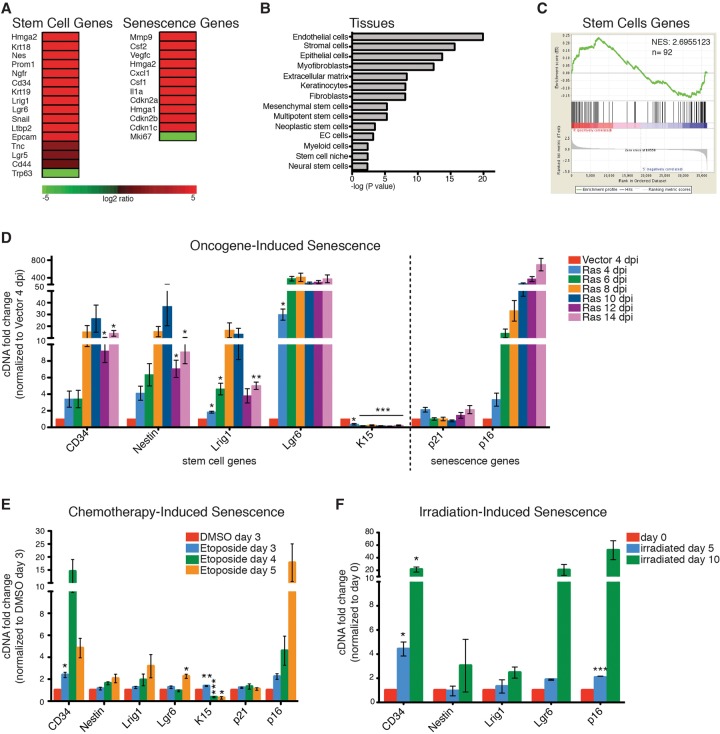
Figure 1.
A stem cell signature is increased in senescent cells. (A) Representative heat map of microarray analysis of HRasV12-induced senescent keratinocytes compared with growing keratinocytes. Example genes are shown to illustrate that stem cell and senescent genes are more highly expressed in senescent cells compared with growing cells. (B) Bioinformatics analysis of genes significantly up-regulated in senescent cells (analysis performed using Genomatix software; full list of up-regulated and down-regulated genes is in Supplemental Table 1). (C) GSEA of stem cell genes (Blanpain et al. 2004) in the gene expression profile of Ras-induced senescent keratinocytes. (NES) Normalized enrichment score. (D) qPCR analysis for skin stem cell and senescence genes in Ras-infected keratinocytes at 4–14 d post-infection (dpi) normalized to vector-infected keratinocytes at 4 dpi. n = 4, except for 14 dpi (n = 3). (E) qPCR analysis of etoposide-treated keratinocytes 3–5 d after treatment normalized to DMSO-treated keratinocytes 3 d after treatment. n = 5, except for day 5 (n = 3). (F) qPCR analysis of irradiated keratinocytes (12 Gy) 5 and 10 d after irradiation normalized to keratinocytes before irradiation. n = 2. (D–F) Error bars indicate mean ± SEM. (*) P < 0.05; (**) P < 0.01; (***) P < 0.001), two-tailed Student's t-test.

