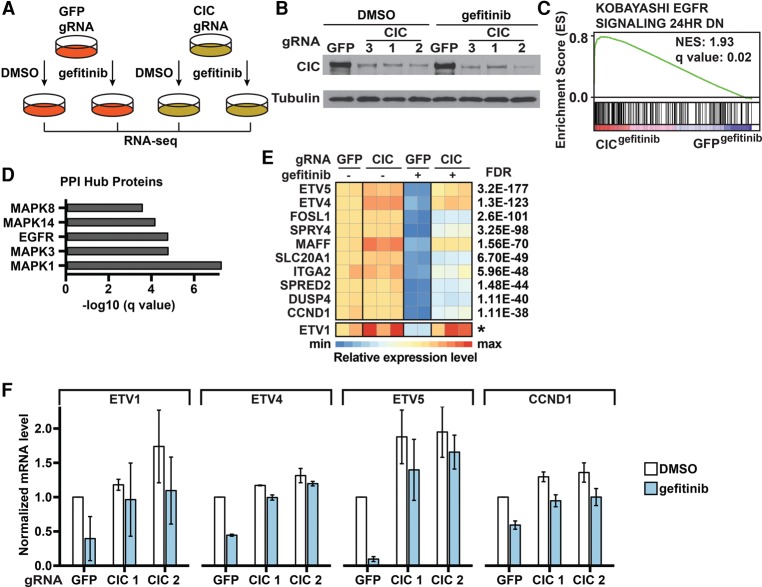
Figure 4.
Identification and functional evaluation of genes regulated by CIC. (A) Schematic of the RNA sequencing (RNA-seq) analysis. Cells were treated with DMSO or 30 nM gefitinib for 6 h. Differentially expressed genes (DEGs) were identified using edgeR. (B) Confirmation of CIC knockout in PC9 cells using immunoblots. (C) EGFRi resistance signature enrichment plot (using Kobayashi EGFR Signaling 24hr DN signature data sets obtained from the gene set enrichment analysis [GSEA]). The plot indicates a significant up-regulation of EGFR signatures in CIC gRNA-expressing PC9 cells compared with GFP gRNA-expressing PC9 cells during gefitinib treatment. (NES) Normalized enrichment score. (D) Protein–protein interaction (PPI) hubs among the DEGs between CIC gRNA-expressing and GFP gRNA-expressing PC9 cells during gefitinib treatment. (E) Heat map of expression levels (Z-scores) of the top up-regulated genes in CIC gRNA-expressing compared with GFP gRNA-expressing PC9 cells during gefitinib treatment. Each sample was normalized to the basal condition (GFP gRNA-infected, DMSO-treated sample 1). FDRs were calculated by comparing CIC gRNA-expressing cells with GFP gRNA-expressing cells during gefitinib treatment. The asterisk for ETV1 indicates that we were unable to calculate an FDR, as the total read counts were too low, but it ranks in the top 10 by fold change. (F) RT-qPCR analysis of mRNA expression of the indicated genes in CIC gRNA-expressing or GFP gRNA-expressing PC9 cells treated with DMSO or 30 nM gefitinib for 6 h. Data are the means ± SD. n = 3.

