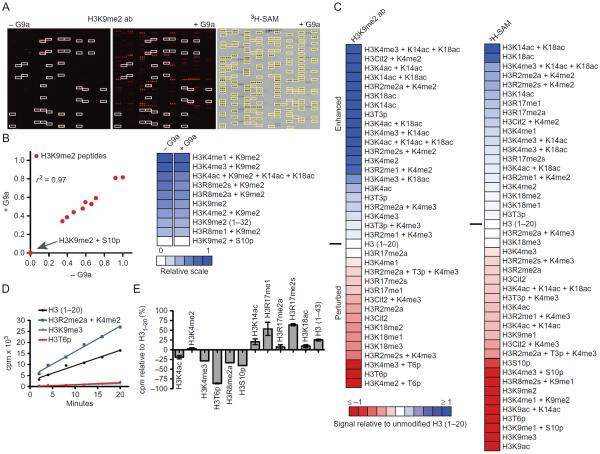
Fig. 3.
Analysis of G9a histone substrate specificity and the combinatorial PTM influence on KMT activity. G9a histone substrate specificity was profiled using the described antibody and radioisotopic detection strategies on large-format histone peptide micro-arrays. (A) Representative images of arrays detected with an H3K9me2 antibody (Abcam #1220) following hybridization in the absence or presence of 1 μM G9a for 2 h (left). White boxes demarcate peptides detected by H3K9me2 antibody in the absence of G9a. Image of autoradiography film exposed for 1.5 months following a 2-h array assay with 1 μM G9a and 5 μCi 3H-SAM (right). For comparison, yellow boxes demarcate peptides detected with H3K9me2 antibody in the presence of G9a. (B) Scatter plot (left) and heat map (right) of H3K9me2 peptides detected by the above-mentioned H3K9me2 antibody in the absence or presence of G9a. Correlation coefficient (r2) was calculated by linear regression analysis using GraphPad Prism v6. For heat maps, relative signal intensities are plotted using JavaTreeView (Saldanha, 2004) from 0 (white, no binding) to 1 (blue, strong binding). (C) Heat maps depicting the effects of combinatorial PTMs on the enzymatic activity of G9a from panel (A). Enhanced (1, blue) and occluded (−1, red) effects are depicted. Peptide signal intensities are presented relative to H3(1–20) (0, white) following detection with the above-mentioned H3K9me2 antibody (left) or autoradiography (right). (D) In-solution 3H-SAM filter-binding assays monitoring G9a activity as a function of time on the listed histone peptide substrates. Data points are presented as counts per minute (cpm), each from three independent measurements. (E) In-solution 3H-SAM filter-binding assays monitoring G9a activity following a 10-min incubation with the listed histone peptide substrates. Data points are presented as cpm relative to an H3(1–20) substrate. Error bars represent ±S.E.M. from three independent experiments.

