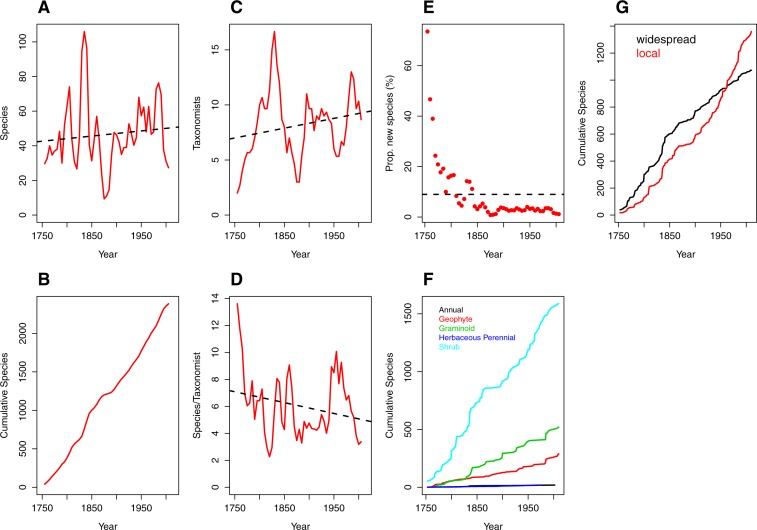
Figure 1. Trends over time (1753–2012) in species discovery rates and taxonomic effort in the Cape Floristic Region, South Africa.
(A) Total number of species described, (B) cumulative number of species, (C) number of taxonomists involved in describing species (“taxonomic effort”) and (D) species described per taxonomist (“taxonomic efficiency”). Plotted lines are moving average functions (sensu Joppa, Roberts & Pimm, 2011a) calculated at five-year time intervals across the study period (i.e., 1753–2012). (E) The proportion (%) of new species described per five-year interval, (F) cumulative number of species per growth form (annual [19], geophyte [289], graminoid [520], herbaceous perennial [19] and shrub [1587]) and (G) cumulative number of species by phytogeographic centre (widespread and local; see main text for details) across the study period. Trend lines (dashed black) in (A, C, D) are based on linear model fits whereas the trend line in (E) is based on a mean rate of 8.98 species described.

