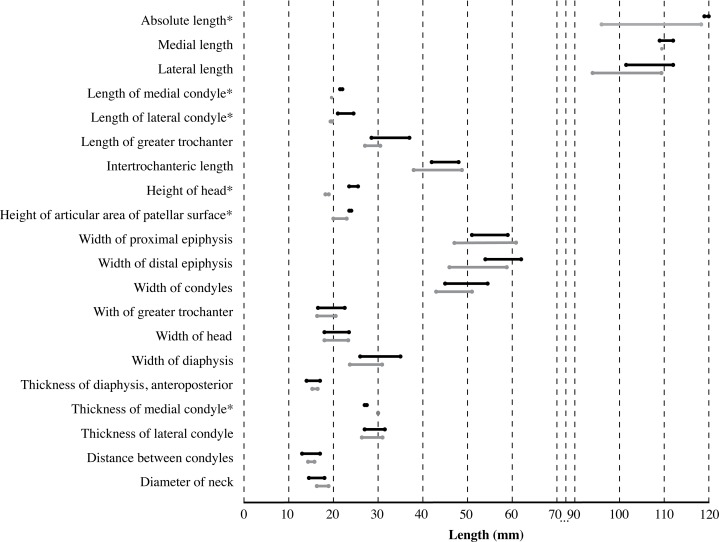
Figure 15. Biometric measurements of Leptophoca proxima and Leptophoca amphiatlantica.
Graph comparing biometric measurements of Leptophoca proxima and Leptophoca amphiatlantica, adopted from measurements presented by Koretsky (2001; L. proxima as Leptophoca lenis) and Koretsky, Ray & Peters (2012; Leptophoca amphiatlantica). Measurement ranges in black (upper) for Leptophoca proxima and in gray (lower) for Leptophoca amphiatlantica. Characters with no overlap between both OTUs are indicated by an asterisk.

