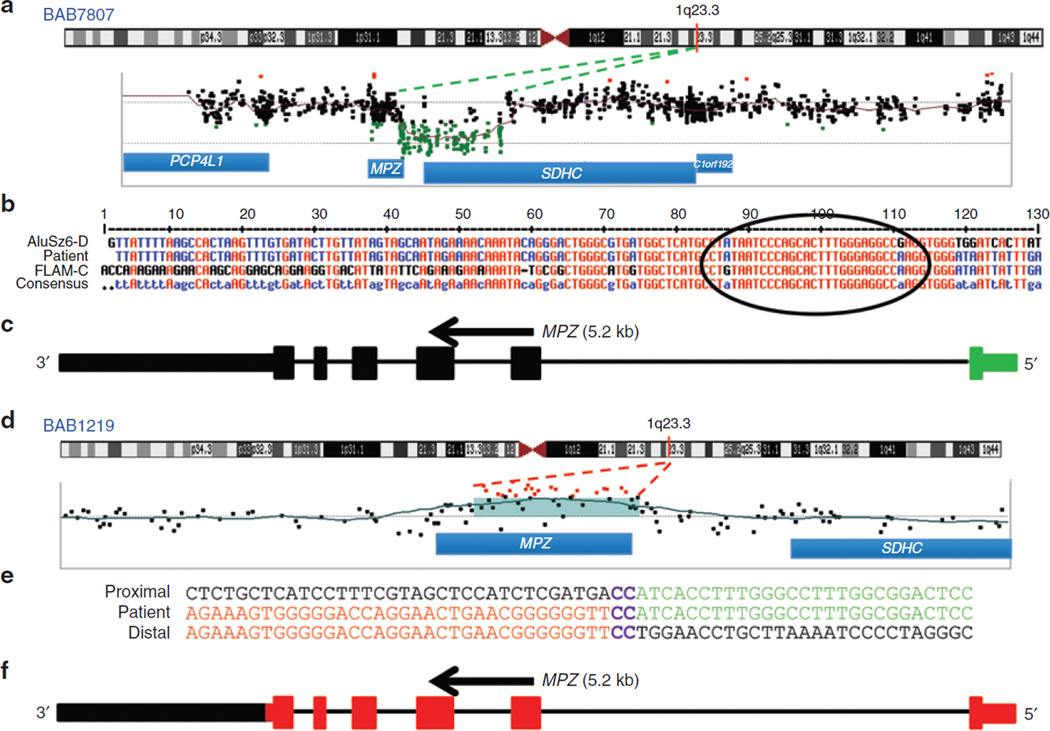
Figure 2. Array comparative genomic hybridization (CGH) and breakpoint junction studies of the MPZ gene deletion (in BAB7807) and duplication (in BAB1219).
(a) Chromosome 1 ideogram with G bands indicated (top). The location of MPZ is shown with a red vertical line at 1q23.3. Array CGH results of the 20-kb deletion involving upstream parts of both MPZ and SDHC. (b) Breakpoint sequence analysis for MPZ deletion using the MultAlin alignment tool. Proximal and distal reference sequences are mapped within FLAM_C and AluSz6-D sequences, respectively. The patient’s breakpoint sequence that matches the reference sequence is shown in blue, mismatched sequence is shown in black, and perfect matching between all three sequences are shown in red. The breakpoint junction where the transition occurred from the proximal to the distal reference sequence is specified with a black circle. (c) Graphic representation of MPZ (vertical bars; deleted exon 1 is shown in green); size and orientation of the gene are shown above the exons. (d) Chromosome 1 ideogram with G bands as described in Figure 2a. Array CGH results reveal genomic duplication. The red line indicates MPZ on chromosome 1q23.3. (e) Breakpoint sequence analysis for MPZ duplication. The proximal and distal sequences are from hg19/GRCh37. Proximal reference sequence and patient breakpoint sequences that match the proximal reference sequence are shown in red, the distal reference sequence and patient breakpoint sequences that match the distal reference sequence are shown in green, and 2-bp microhomology (CC) at the junction is shown in purple. (f) Graphical representation of six exons of MPZ (vertical bars; duplicated exons are shown in red); the size and orientation of the gene are shown above the exons.

