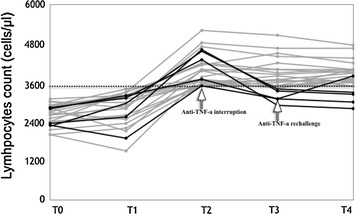
Fig. 1.

Total lymphocyte count (cells/µl) in 25 patients with lymphocytosis throughout the follow-up. Dashed line indicates the upper limit of normal lymphocyte count. T0 Methotrexate ± steroids therapy; T1 Addition of anti-TNF-a therapy; T2 Peak of lymphocytes level (bold black lines identify the patients in whom anti-TNF-a therapy was interrupted); T3 Three months from T2; T4 Twelve months from T2
