Fig. 3.

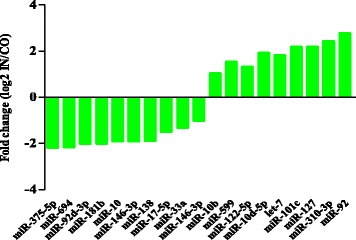
Fold changes of differentially expressed miRNAs between the control group (CO) and infected group (IN). Fold changes were calculated as log2 (IN/CO)

Fold changes of differentially expressed miRNAs between the control group (CO) and infected group (IN). Fold changes were calculated as log2 (IN/CO)