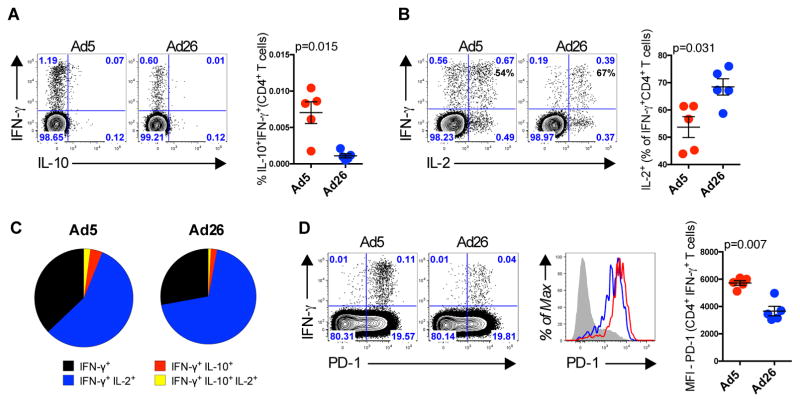
Fig. 5. CD4 T Cells From Rhesus Monkeys Upregulate the Expression of IL-10 and PD-1 Following Ad5 Immunization.
(A to D) Rhesus Monkeys were immunized intramuscularly with 1010 vp of Ad5-Gag or Ad26-Gag, and Gag-specific CD4+ T cells from PBMCs were evaluated 2 weeks post immunization. Representative flow plots are shown gated on CD4+CD69+ T cells. (A) Co-expression of IFN-γ and IL-10 and (B) co-expression of IFN-γ and IL-2. (C) Pie chart showing the CD8+ T cells cytokine polyfunctionality distribution. (D) Co-expression of IFN-γ and PD-1 gated on CD4+CD69+ T cells. Histogram plots showing the expression of PD-1 by IFN-γ+ CD4+ T cells. Group summary graph showing the IFN-γ mean fluorescence intensity (MFI). Each dot represents an individual monkey (n=5 per group). p values were calculated using Mann-Whitney U. Mean ± SEM is shown.

