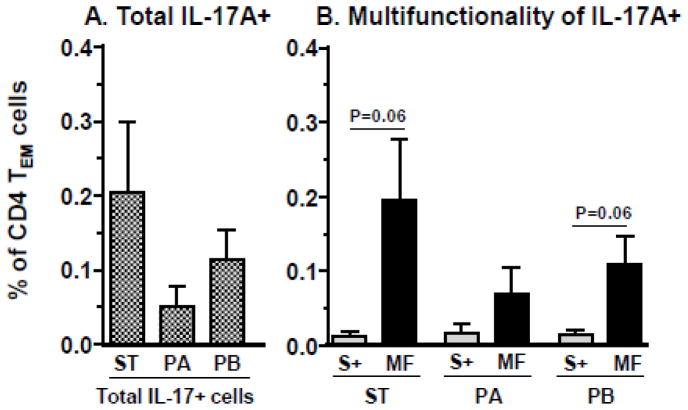
Figure 6. Post-vaccination increases in IL-17A producing CD4+ T EM cells.
Total IL-17A producing CD4+T T EM cells responses (A) were measured in Ty21a vaccinees (n=8) following stimulation with S. Typhi (ST)-, S. Paratyphi A (PA)- and S. Paratyphi B (PB)-infected targets. Post-vaccination increases in Salmonella-specific-IL17A+ producing CD4+ T EM cells were further categorized into Single positive (S+) and multifunctional (MF) cells (sum of all subsets except S+) (B). Error bars represents Mean+SEM.
The peak-post vaccination increases (days 42 or 84) were calculated by subtracting the corresponding pre-vaccination (day 0) levels.
p values shown were determined by Wilcoxon signed rank test, 2-tail.

