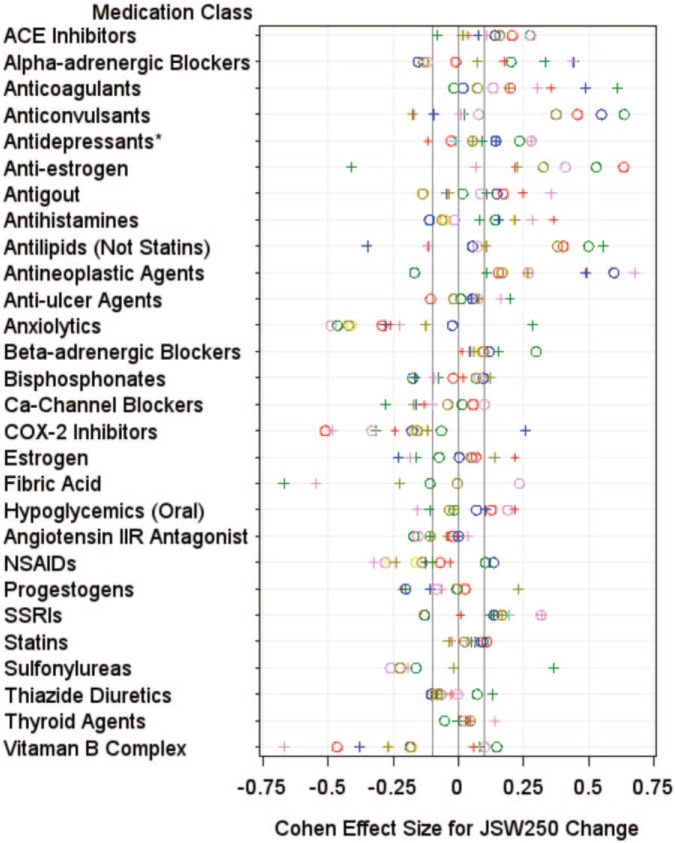
Figure 1.
Plots demonstrating the distribution of standardized effect sizes for joint space width change. The plots demonstrate the standardized effect sizes from eight comparisons (represented by different colors) per knee (left knee = pluses, right knee = circles). *Antidepressants (not including selective serotonin reuptake inhibitors).

