
Fig 4. Correlation between density of An. darlingi on barrier screens and wind speed.
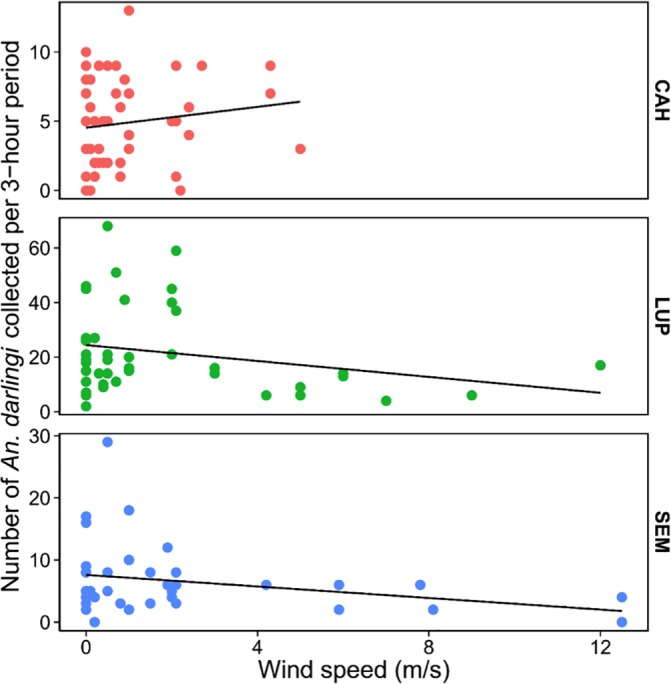
Mosquitoes were collected from 6pm-6am from January-June 2015 in CAH and LUP and May-September 2015 in SEM. Linear regression of mosquito density on wind speed shown for each location (CAH: Pearson’s r = 0.14, p = 0.34; LUP: Pearson’s r = -0.25, p = 0.1; SEM: Pearson’s r = -0.27, p = 0.09).