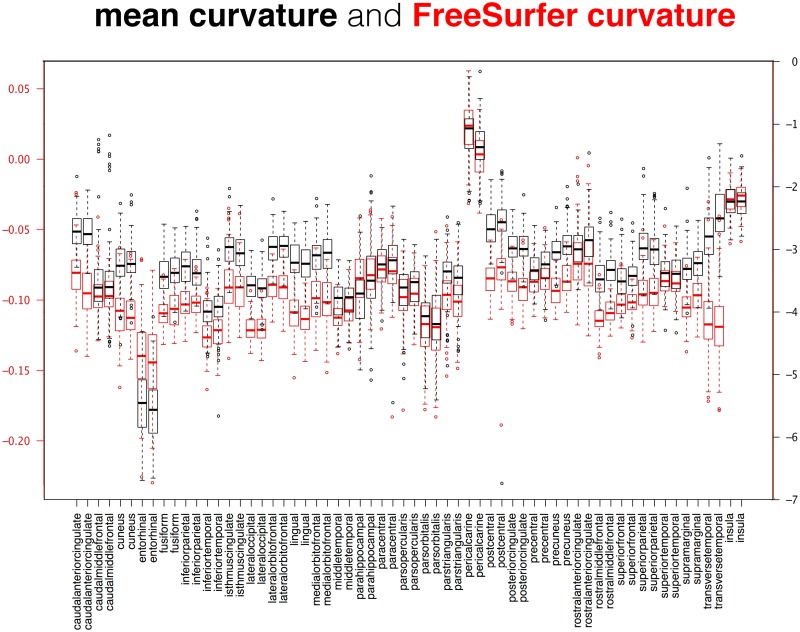
Fig 12. Comparison between cortical curvature measures.
This superposition of two box and whisker plots is a comparison between two measures of cortical surface curvature applied to the 101 Mindboggle-101 brains: Mindboggle’s mean curvature and FreeSurfer’s curvature measure. These surface measures are computed for every mesh vertex, so the plots were constructed from median curvature values, with one value per labeled region. The Mindboggle curvature measures were greater than the FreeSurfer curvature measures for almost all regions, with the notable exception of the entorhinal regions (fourth pair from the left).

