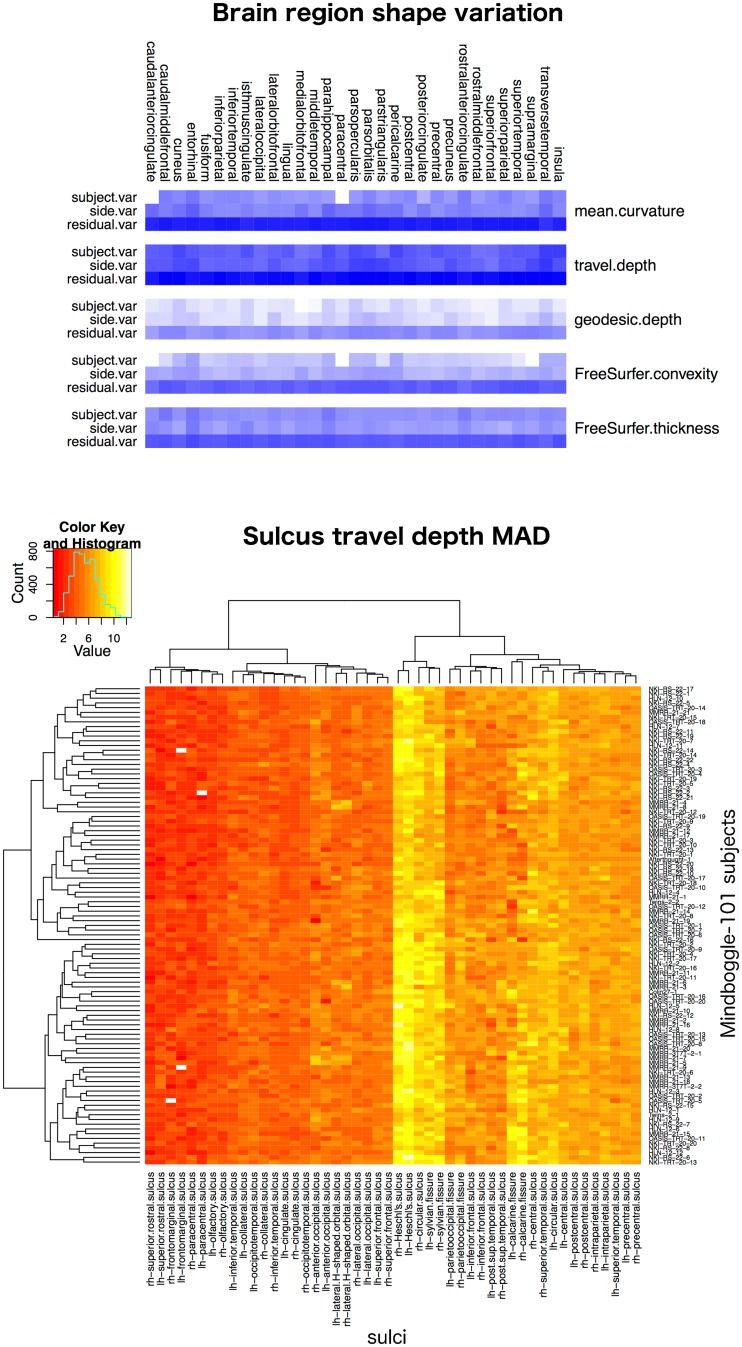
Fig 14. Brain shape variation in healthy humans.
Top: Overview of the variance results for five shape measures computed on each of 31 manually labeled cortical regions (combined across both hemispheres for this figure) in the 101 Mindboggle-101 healthy human brains. The blue color-coded heatmap shows the relative contributions of subject, hemisphere, and residual to describe the variability for each shape measure, with a greater contribution coded by a darker blue. For all shape measures and brain regions, most of the variability was concentrated in the residual. See the S5 Supplement for a description of the statistical models. Bottom: An example heatmap table containing 4,848 cells, where each cell is color-coded (increasing from red to yellow) to represent the median absolute deviation of travel depth values across all vertices in each of 48 sulcus surface meshes for the 101 subjects. It is clear that there is greater consistency across subjects for a given region (colors within a column) than across regions for a given subject (colors within a row).

