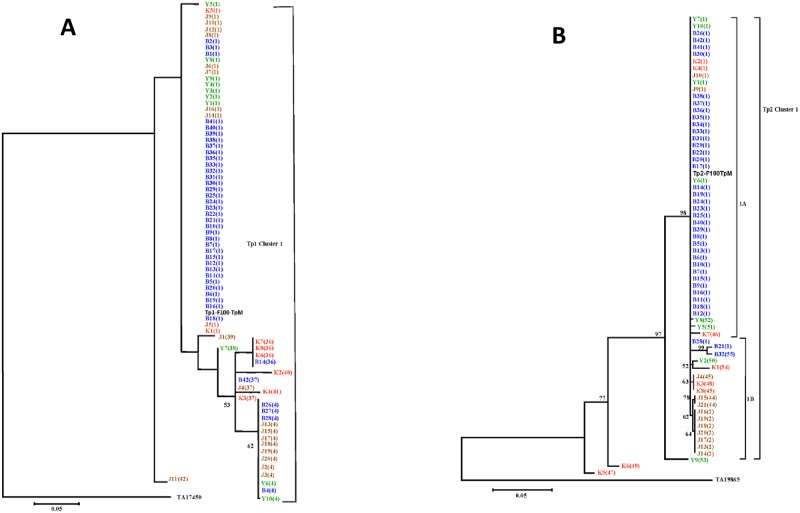
Fig 3. Neighbour-joining trees of Tp1 and Tp2 gene sequences indicating phylogeographic relationships among cattle derived T. parva isolates.
The isolates are color-coded based on their geographic origin in South Sudan and alleles which are represented by these samples are shown in brackets. The colour codes are as follows: Bor = Blue; Juba = Orange; Yei = Green; Kajo keji = Red. Bootstrap values >50% are shown above the nodes. (A) Tree showing relationships between Tp1 gene sequences from 79 cattle isolates of T. parva. The TP03_0849 gene from the T. parva (Muguga) genome sequence was also included in the analysis (Tp1-F100-TpM). The sequence of T. annulata Tp1 homologue (TA17450) was used to root the tree. (B) Tree showing relationships among Tp2 gene sequences from 65 cattle-derived T. parva isolates. The TP01_0056 gene from T. parva (Muguga) genome sequence was also included in the analysis (Tp2-F100-TpM). The Tp2 homologous sequence from T. annulata (TA19865) was used to root the tree.

