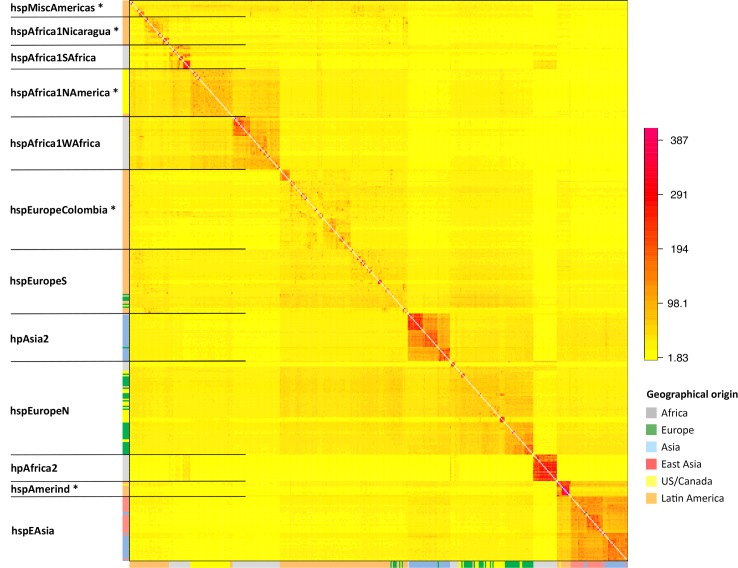
Fig 1. Population structure of global H. pylori strains.
The colour of each cell of the matrix indicates the expected number of DNA chunks imported from a donor genome (column) to a recipient genome (row). The boundaries between named populations are marked with lines, with New World populations marked with an asterisk. The colour bar on the left indicates the geographical locations where the strains were sampled.

