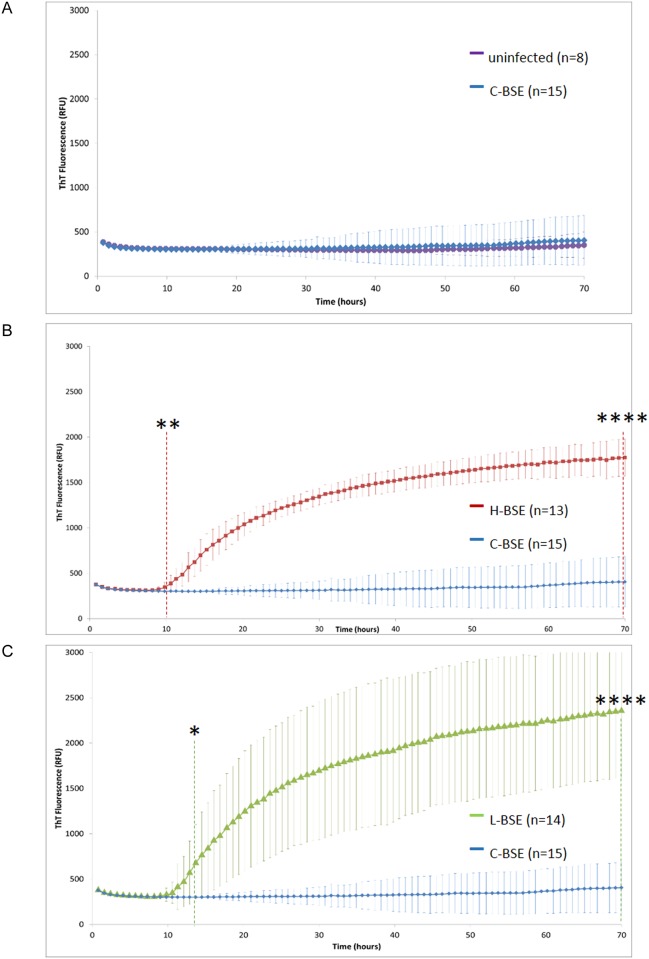
Fig 2. Conversion of human recombinant PrP by atypical BSE strains.
Average data and statistical significance of the individual results shown in S1 Fig are represented here. (A), classical BSE isolates and uninfected bovine samples. (B), classical BSE and atypical H-BSE isolates. (C), classical BSE and atypical L-BSE isolates. Each point represents the mean value of 3 replicate relative fluorescence unit readings, which were averaged over the number of animals in each group. Error bars represent the mean standard deviation (SD). Vertical dashed lines indicate a statistically significant difference of signal between the test groups. *, p<0,05; **, p<0,01; ****, p<0,0001.

