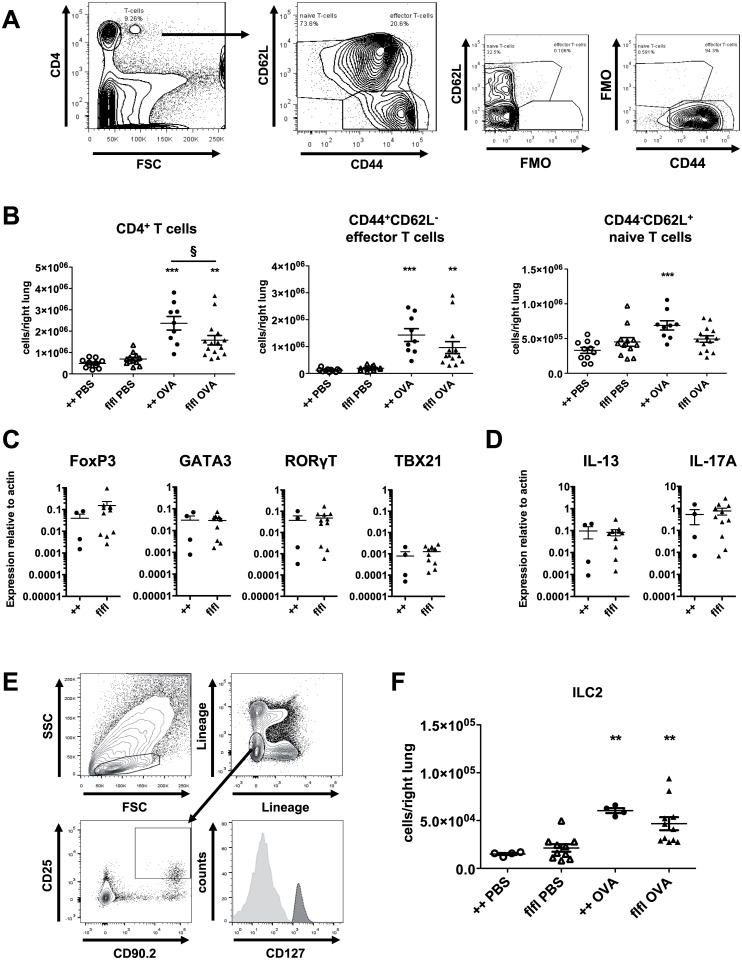
Fig 3. CD4+ T cell and ILC2 accumulation as well as CD4+ T cell differentiation in WT and GFP-C5aR1flox/flox mice in the allergic effector phase.
(A) Gating strategy to identify CD4+ T cells. T cells were subdivided into naive (CD44-CD62L+) and effector (CD44-CD62L+) T cells. (B) Recruitment of different T cell populations into the lungs of PBS-treated or OVA-immunized WT or GFP-C5aR1flox/flox animals. Values shown are the mean ± SEM; n = 9–15 per group. (C) Expression of FoxP3 (Tregs), GATA3 (Th2), RORγT (Th17), and TBX21 (Th1) transcripts in sorted CD44+CD62L- T cells. The abundance of transcripts was evaluated after reverse transcription by real-time PCR. Values shown are the mean abundance of target mRNA as compared to actin analyzed by Mann-Whitney test (n = 4–11). (D) Comparison of IL-13 and IL-17A mRNA expression levels in WT and GFP-C5aR1flox/flox mice in sorted CD44+CD62L- T cells as determined by real-time PCR. Values shown are the mean abundance of target mRNA as compared to actin analyzed by Mann-Whitney test (n = 4–11). (E) Gating strategy used to identify ILC2 in lung tissue (Lin-CD25+CD90.2+CD127+). (F) ILC2 cell numbers in lung tissue of PBS-treated or OVA-immunized WT or GFP-C5aR1flox/flox animals. Values shown are the mean ± SEM; n = 4–11 per group. * indicates significant differences between PBS or OVA-treated groups; § indicates significant differences between WT and GFP-C5aR1flox/flox OVA-treated groups. § p < 0.05, ** p < 0.01, *** p <0.001.

