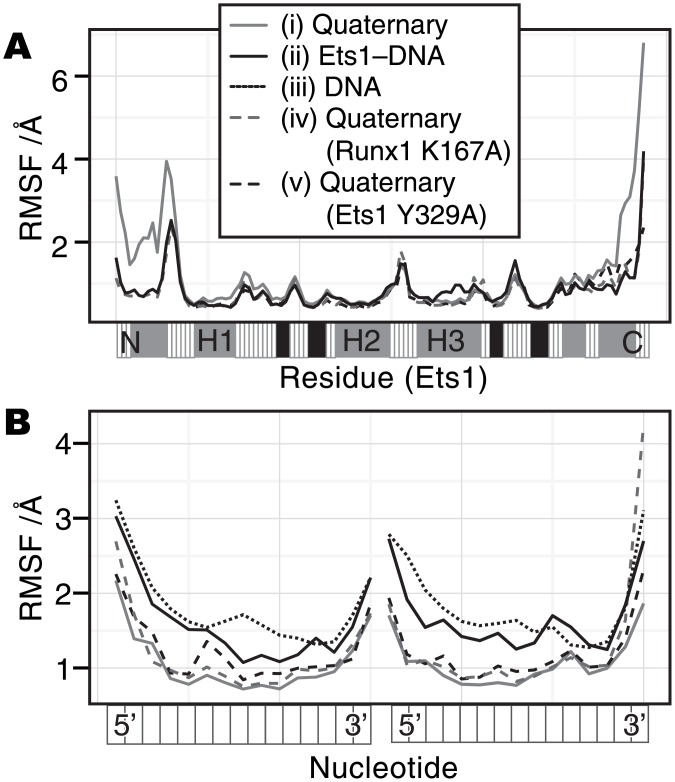
Fig 1. The RMSF value of each residue.
(A) The RMSF values of the Cα atoms in Ets1. (B) The RMSF values of the phosphorus atoms in DNA. The horizontal axes represent each residue of the molecule from the N-terminus to the C-terminus for Ets1, and from 5’ to 3’ for the DNA. The grey solid line, black solid line, grey dashed line, black dashed line, and black dotted line indicate the results from (i) the quaternary complex, (ii) the Ets1–DNA complex, (iii) the isolated DNA, (iv) the K176A model, and (v) the Y329A model, respectively. The bar below the plot in panel (A) is a secondary structure guide of Ets1: grey, black and white indicate α-helix, β-strand, and others, respectively. For the RMSF calculations of each molecule, the trajectories were superimposed only on the backbone atoms of the molecule, and the other molecules in the model were ignored.

