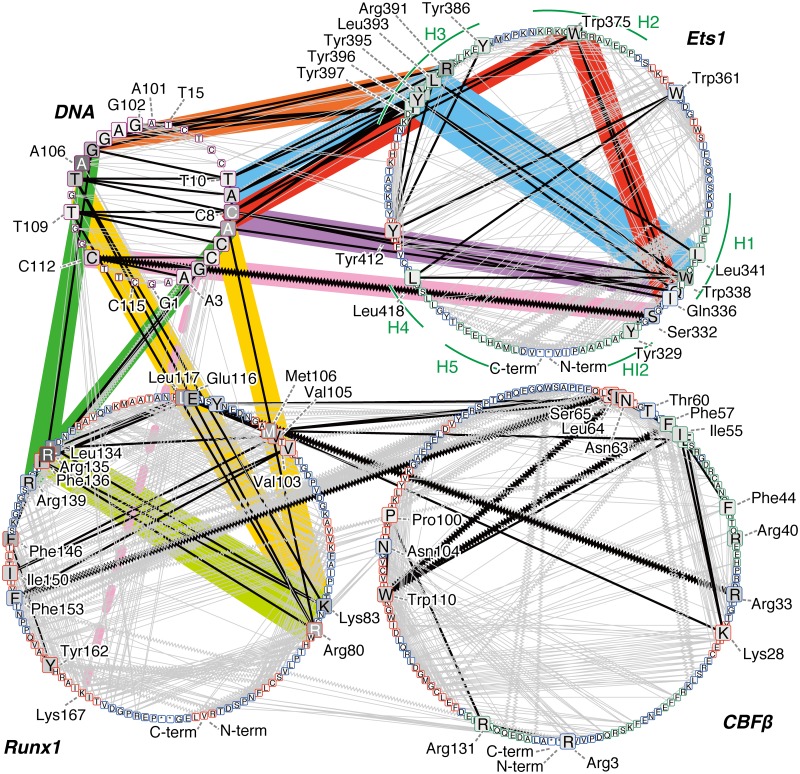
Fig 5. The correlation network of the wild-type quaternary complex.
Each node indicates each residue, labeled with the one-letter codes for amino acids and nucleotides. An asterisk “*” denotes the termini of polypeptides, i.e., N-methyl and acetyl groups. The circles correspond to DNA (upper-left circle), Ets1 (upper-right), Runx1 (lower-left), and CBFβ (lower-right). Nodes are aligned in the sequence order for each molecule in the counter-clockwise direction, starting from the bottom of each circle. The colors of the nodes indicate the betweenness values: higher values are darker. In particular, the top 15 highest betweenness residues in each molecule are shown as large squares. The colors of the node borders indicate the secondary structures of the residues: green, red, and blue represent α-helix, β-strand, and others, respectively; nodes in DNA are shown as a purple border. Edges are drawn between nodes with highly positive correlations (mDCC ≥0.5) with contact (distance between the centers <5Å). Edges between the top 15 betweenness residues are colored black, and other edges are grey. Zigzag edges indicate transient interactions, meaning that DCC <0.5 but mDCC ≥0.5. Some edges that are particularly discussed in the main text are highlighted with a colored background.

