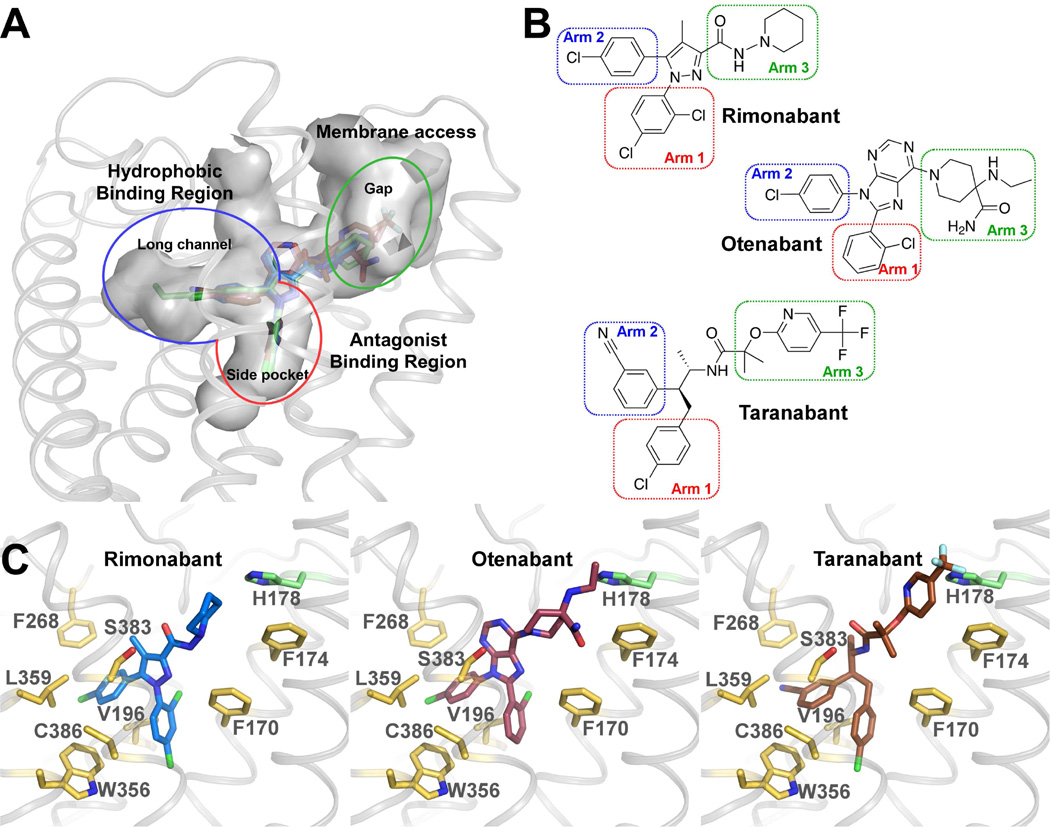
Figure 5. Docking of Different Antagonists in the CB1 Crystal Structure.
(A) CB1 binding pockets with rimonabant (blue sticks), otenabant (raspberry sticks) and taranabant (brown sticks) are shown in gray surface representation. (B) Chemical structures of rimonabant, otenabant and taranabant. The red/blue/green rectangles highlight previously described arms termed as arm 1/arm 2/arm 3 (see Figure 3C). (C) Predicted binding modes of rimonabant (blue sticks), otenabant (raspberry sticks) and taranabant (brown sticks) with CB1. The interacting residues are shown in yellow sticks and H178 is shown in green sticks. See also Figure S4 and Table S2.

