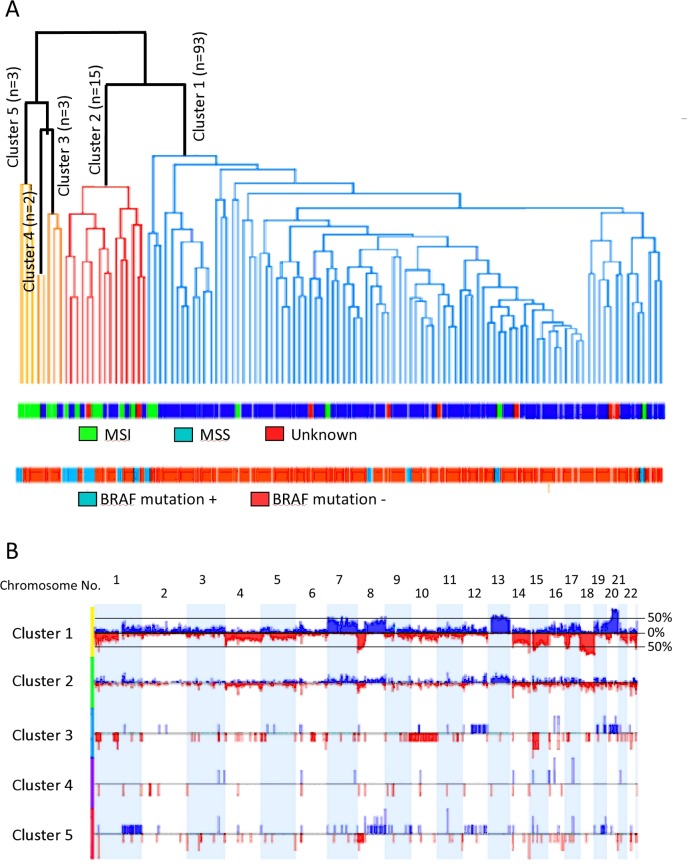
Fig 4.
a) Complete Linkage Hierarchical clustering of 116 cases with CRC. The generated 5-clusters are depicted in the dendogram. The lower panels show microsatellite stability and BRAF gene status. b) Frequency (aggregate) histograms from 5-groups of CRCs clustered according to copy number aberration patterns. The upper histogram represents the summation of all the aberrations in 116 cases of CRC. Deviations up from 0% (Log2 ratio) represent copy number gains and are colored blue, while deviations below the 0% line (red) represent copy number losses. The y-axis represents % of samples with a specific aberration. The two horizontal lines demarcate the cutoff (35%) used to call aberrations in the STAC algorithm. The lower histograms are aberrations found in the 5 generated clusters.

