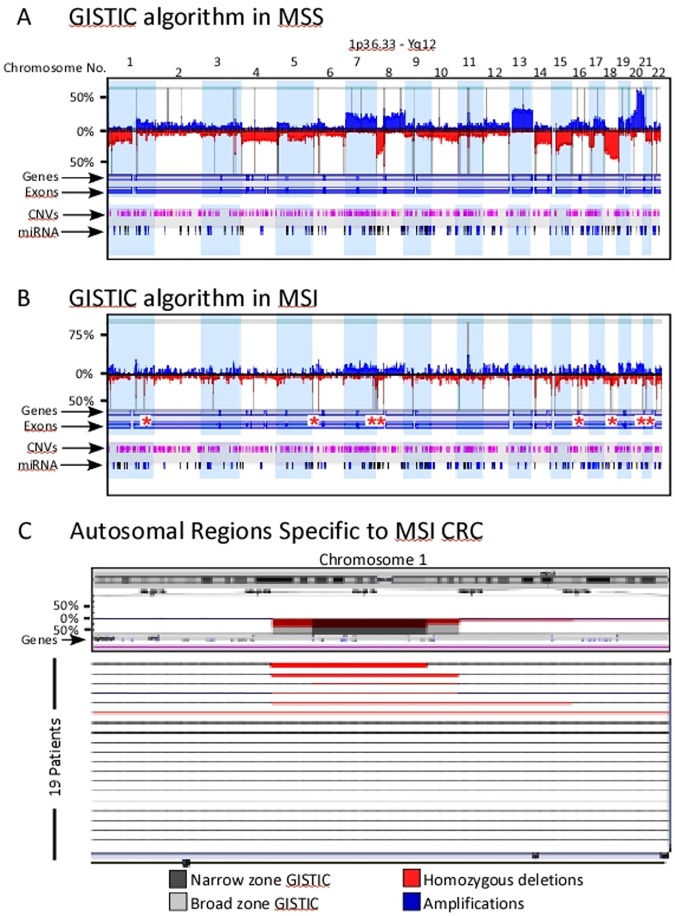
Fig 7. GISTIC analysis of MSS and MSI CRC copy number aberrations.
a) Histogram profile of the autosome from 89 MSS and b) from 19 MSI CRC. Deviations up from 0% represent copy number gains and are colored blue, while deviations below the 0% line represent copy number losses and are colored red. Vertical grey lines indicate regions identified as significant using the Q-Bound (p>0.05) and G-score>1. Asterisks, pinpoint narrow GISTIC regions identified only in MSI CRC cases. c) Zoomed in view of the regions private to MSI CRC showing the corresponding chromosome ideogram on top and focused GISTIC-identified areas with broad (grey) and narrow (dark grey) zones along the histograms (middle) and the 19 patients (lower panels), each represented in a horizontal line indicating the deletions in red, homozygous deletions in dark red/broad red lines and amplifications in blue.

