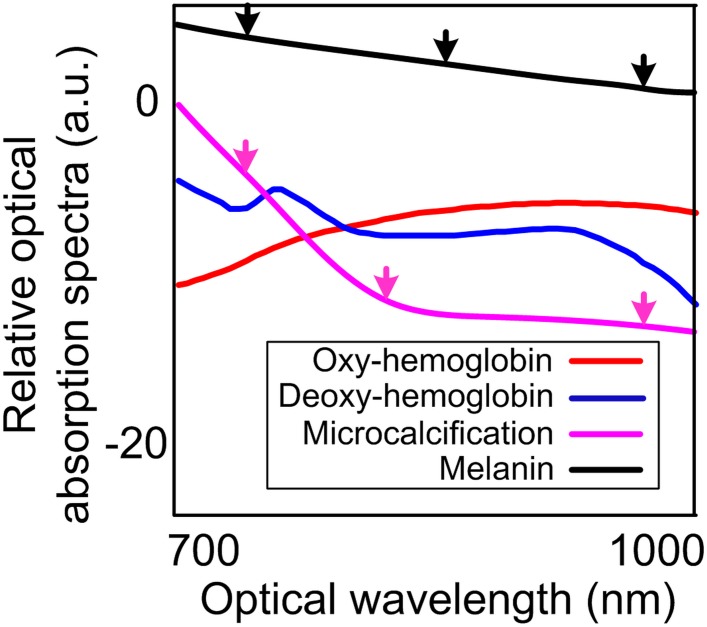
Fig 2. Optical absorption spectra of major molecular components in intraocular tumors [12, 34].
The black arrows indicate that the optical absorption spectrum of melanoma constantly decrease with respect to the increase of wavelengths. The optical absorption spectrum of the microcalcification shows a rapid decrease between the first two magenta arrows and a large curvature at the second magenta arrow. Both changes were captured in the PA images of retinoblastoma in the results section.

