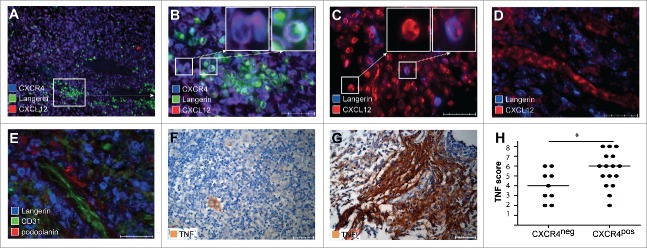
Figure 2.
High TNF and CXCL12 expression in LCH lesions correlates with the presence of CXCR4+ LCH-cells. LCH lesions (n = 25) were stained with antibodies specific for the LCH-cell-specific marker Langerin (green color in A–B and blue color in C–E), CXCL12 (red color in A–D),CXCR4 (blue color in A–B), CD31 (green color in E) and Podoplanin (red color in E) or with TNF (brown color in F–G) Representative pictures are taken from lesions with different distribution of CXCL12 (original magnification 40×, scale bar defines 50μm) and of TNF original magnification 20×, scale bar defines 100 μm). Inserts depicted at the upper right corner of B and C are a larger magnification of the cells in the indicated areas. (A–B) Pictures taken at 10× magnification (A) and 40× magnification (B) from the depicted area in A. Pictures are showing that CXCL12 is expressed by CXCR4+ Langerin+ LCH-cells, resulting in a purple, turquoise cell (right insert in B) which are surrounded by Langerin− bystander cells that co-express CXCL12 and CXCR4 (left insert in B) (C) Picture showing that CXCL12 is expressed by Langerin-negative cells (left insert) and by Langerin-positive LCH-cells, resulting in a purple cell (right insert). (D) Picture demonstrating that CXCL12 is expressed at endothelial cells lining vessels (red) which are surrounded by Langerin-positive-LCH-cells (blue color). (E) A picture taken from the same location in a serial section prepared from the same LCH lesion as displayed in B. This photograph shows that LCH-cells (blue color) surround CD31+ (green color) blood vessels, while some cells stain positive for Podoplanin (red color). (F) Picture of a representative LCH lesion with a TNF combination score three (moderate staining intensity and expression of less than 5% of cells present in the biopsy) and (G) Picture of a representative LCH lesion with combination score eight (strong staining intensity and expression of more than 75% of the cells present in the biopsy) (H) Graph showing correlation analysis of the combination scores of TNF and CXCR4 expression by LCH-cells within the same lesion. Lesions with high TNF scores contained more CXCR4+ LCH-cells (p = 0.01). Line represents median TNF score.

