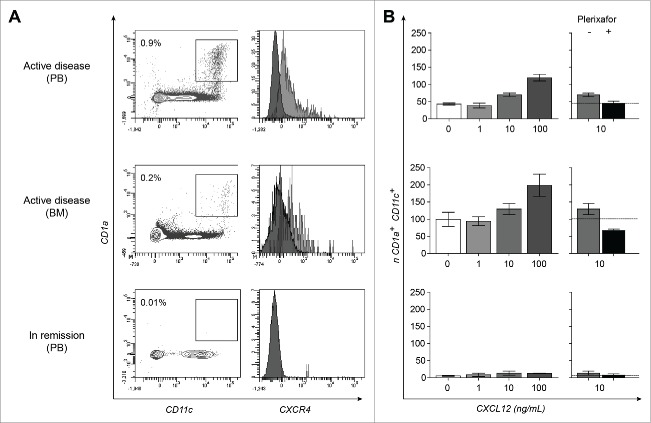
Figure 3.
CXCL12-responsive CD1a+CXCR4+ cells are present in PB and BM samples collected during active multi-system LCH manifestation. Representative FACS dot-plots of a seven-color based flowcytometric analysis (A) and graphs from migration assays (B) performed with PBMC and BMMC from a multi-system patient (LCH7 analyzed at disease onset (upper and middle row respectively) and PBMC collected 5 y after recovery (lower row)). (A) Dot-plot of PBMC showing the increased percentage of Lin−(CD3−CD20−CD56−) CD14+HLA-DR+CD1a+CD11c+ cells (cells depicted in the box) and the mean fluorescence intensity of CXCR4 expression by these CD1a+CD11c+ cells (gray histogram in right plot) compared to unlabeled cells (black histogram in right plot) are shown. Percentage represents the number of CD1a+CD11c+ and CD1a+CD14+ cells among the Lin−(CD3−CD20−CD56−) HLA-DR+ population within the indicated box. (B) Left graphs show the number of CD1a+CD11c+ cells per 10,000 true count beads which migrated in trans well plates from the upper compartment to the lower compartment containing escalating doses of the chemo attractant CXCL12 (0; 1; 10; 100 pg/mL) as measured by flowcytometry. The corresponding right graphs show the migration of Lin−CD1a+CD11c+ cells toward 10 ng/mL CXC12 in the presence (black bars) or absence (gray bars) of the CXCR4-blocking reagent AMD3100 (Plerixafor®), which completely reduced the migration to basal levels in the absence of CXCL12 (horizontal lines). Data represents the mean number of migrating cells per condition as measured in duplicate.

