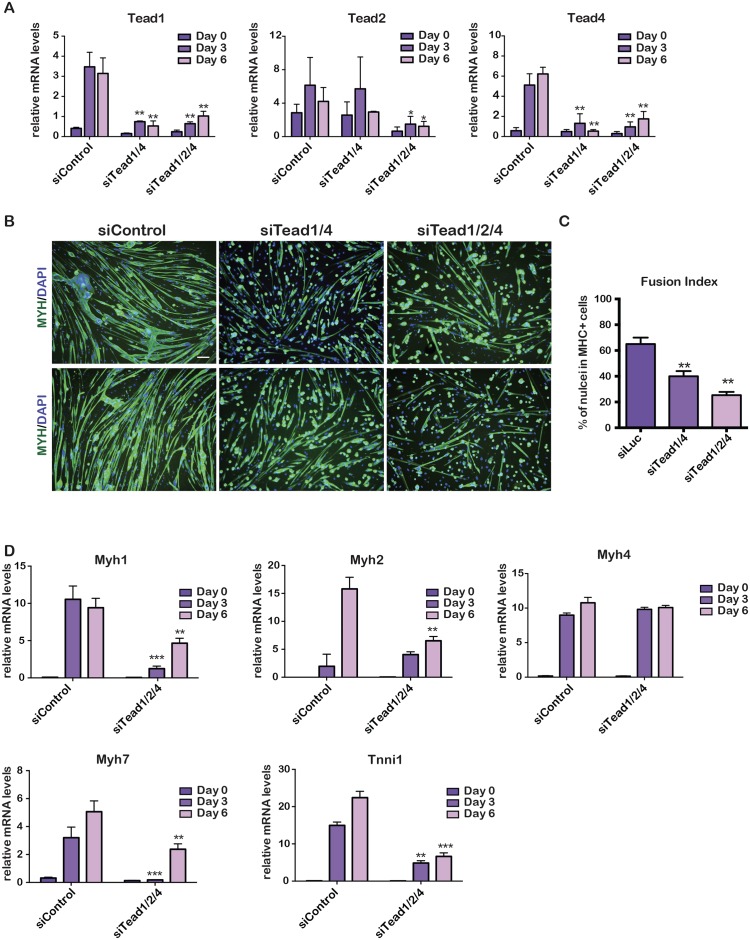
Fig 2. Redundant functions of Tead factors in PMs.
A. Gene expression was quantified by RT-qPCR during PM differentiation after transfection with the indicated siRNAs. B. Fluorescence microscopy images after 6 days of differentiation of PMs transfected with the indicated siRNAs. Green channel shows staining with Myh antibody, and blue Dapi-stained nuclei. Scale bar 100 μm. C. Fusion index of siControl and siTead-transfected cells. D. Quantification of gene expression after transfection with the indicated siRNAs. In panels data was analysed by multiple t-tests. P-values as above. Fusion index was generated from counting around 500 nuclei in each condition from 3 biological replicates.

