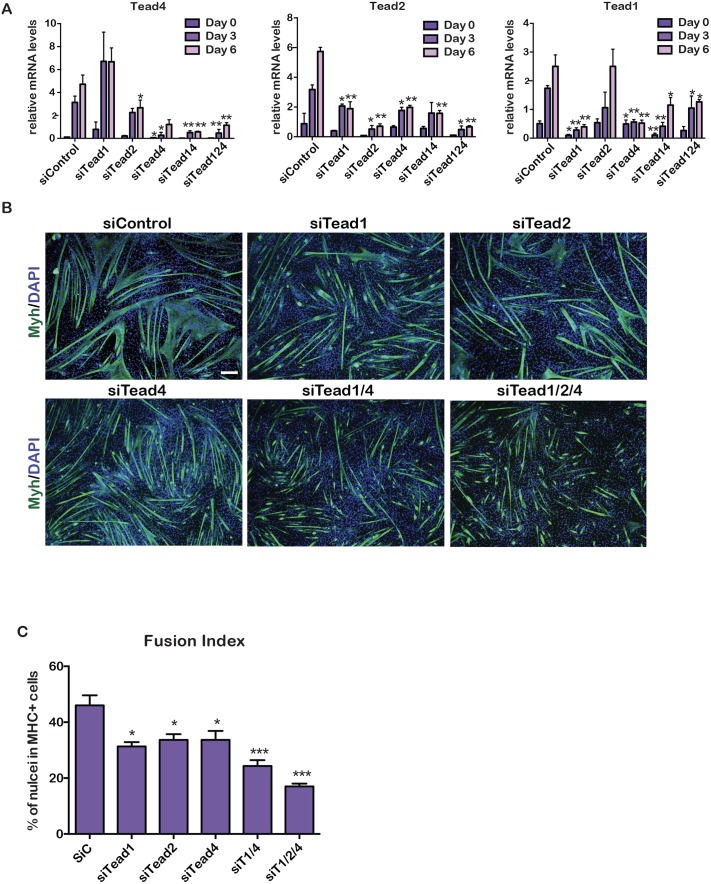
Fig 3. Tead factor function in C2C12 cells.
A. Gene expression was quantified by RT-qPCR during C2C12 cell differentiation after transfection with the indicated siRNAs. B. Fluorescence microscopy images after 6 days of C2C12 cell differentiation following transfection of the indicated siRNAs. Green channel shows staining with Myh antibody. Scale bar 100 μm. C. Fusion index of siControl and following siTead silencing. P-values as above. Fusion index was generated from counting around 1000 nuclei in each condition from 3 biological replicates.

