Figure 3.
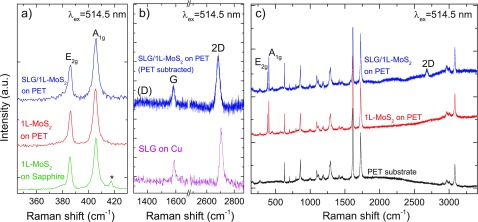
(a) Raman spectra at 514 nm for 1L-MoS2 on sapphire, 1L-MoS2 on PET, and SLG/1L-MoS2. (b) Comparison at 514 nm of the Raman spectra of as-grown SLG on Cu (magenta curve) and SLG/1L-MoS2 after transfer on PET and normalized subtraction of the PET substrate signal (blue curve). (c) Raman spectra at 514 nm of PET substrate (black curve), 1L-MoS2 on PET (red curve) and SLG/1L-MoS2 on PET (blue curve).

