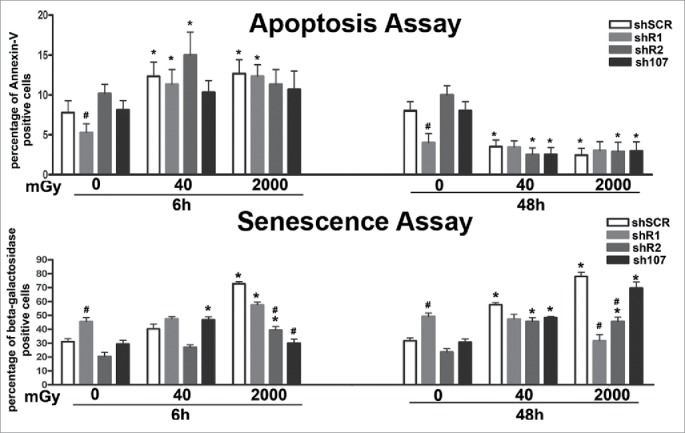
Figure 4.

Evaluation of senescence and apoptosis. For each silenced condition, the upper graph shows the mean percentage of β-galactosidase positive cells either in basal conditions or 6 and 48 hours post-irradiation. The lower graph shows the mean percentage of Annexin V positive cells. Data are expressed with standard deviation. shR1, shR2 and sh107 cells were tested vs. control MSCs (shSCR, #p < 0.05). In each silenced condition (shSCR, shR1, shR2 and sh107), we compared irradiated versus unirradiated cells (*p < 0.05). The shSCR wild type MSCs; shR1, shR2 and sh107 are MSCs with silenced RB1, RB2/P130 and P107, respectively.
