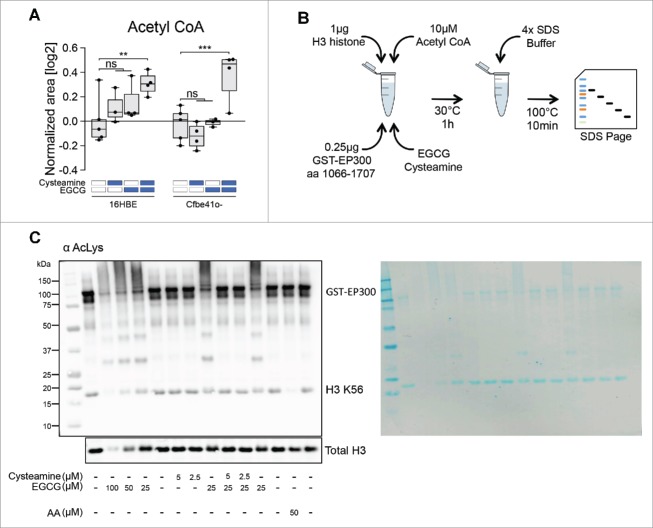
Figure 4.
Effects of cysteamine and epigallocatechin gallate (EGCG) on protein cross-linking in a cell-free system. (A) Boxplot representation of Acetyl CoA according to the metabolic profiling (Fig. 1). Data are shown as log2-normalized area for the relative metabolite peak. Asterisks indicate significant differences (moderate t-test) induced by each treatment with respect to untreated controls for both 16HBE and Cfbe41o- cells. (B) Schematic representation of the in vitro acetylation assay in a cell-free system. Reaction was performed using 1 μg H3 histone, 10 μM Acetyl CoA, 0.25 μg GST-EP300 together with cysteamine and EGCG. (C) Immunoblot for acetyl-lysine residues of the in vitro acetylation assay using the indicated concentrations of cysteamine and EGCG. Anacardic Acid (AA) has been used as control for EP300 activation with consequent reduction of H3 K56 levels. Total H3 immunoblot was performed as loading control. The nitrocellulose membrane was stained with Pierce™ Reversible Protein Stain Kit to assess quality of the tested samples (right side of the panel). The images are representative of one experiment that has been performed at least 3 times yielding similar results. ns: non-significant. **p < 0.01, ***p < 0.001.

