Figure 5.
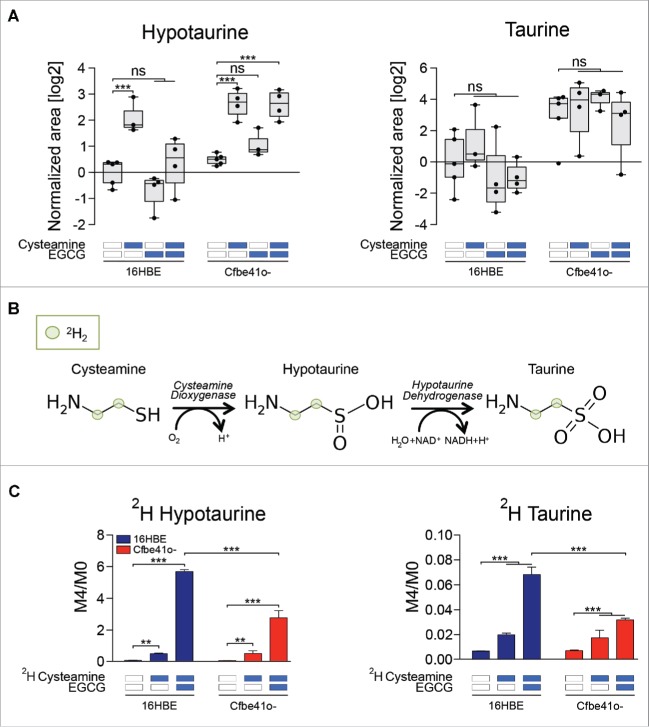
Fluxomic analysis using isotope labeled cysteamine. (A) Boxplot representation of hypotaurine and taurine according to the metabolic profiling (Fig. 1). Data are shown as log2-normalized area for the relative metabolite peak. Asterisks indicate significant differences (moderate t-test) induced by each treatment with respect to untreated controls for both 16HBE and Cfbe41o- cells. (B) Metabolic conversion of cysteamine in taurine and hypotaurine. Cysteamine was labeled with 4 deuterium atoms corresponding to the hydrogens in the carbon chain. (C) Deuterium enrichment of hypotaurine and taurine after treatment with 250 μM of isotope-labeled cysteamine alone or in combination with 100 μM EGCG. Data are shown as the ratio between the levels of the metabolite enriched with 4 deuterium atoms (M4) and the metabolite enriched with no deuterium atoms (M0). Data are reported as means ± SD of 4 replicates; the experiments were repeated twice yielding similar results. **p < 0.01, ***p < 0.001. ns: non-significant.

