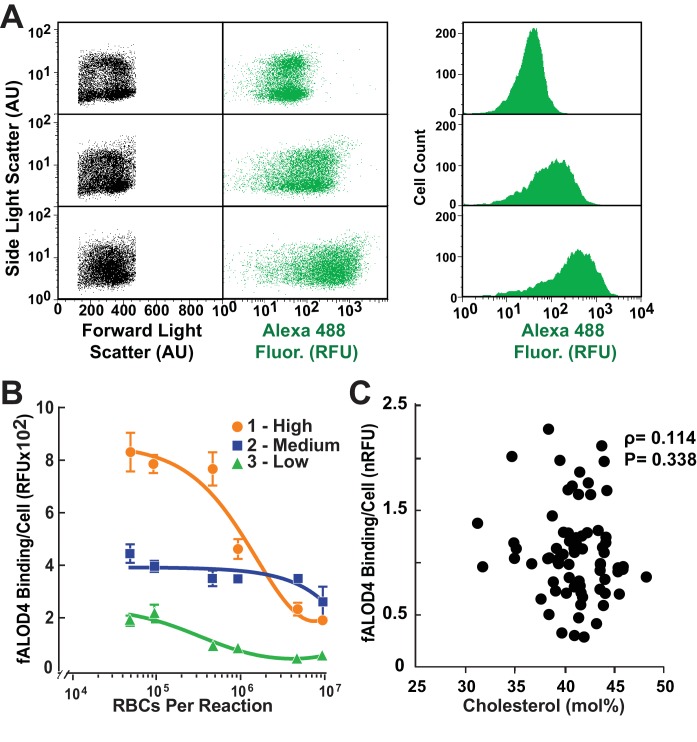
Figure 4. Distribution of fALOD4 binding to RBCs in individuals with low, medium and high binding.
(A) Flow cytometry analysis of fALOD4 binding to RBCs from three individuals with low (top), medium (middle) and high (bottom) fALOD4 binding. Forward light scatter, side light scatter, and Alexa 488 fluorescence measurements of 10,000 RBCs were acquired using a FACSCalibur flow cytometer as described in the Materials and methods. Fluorescence data are presented as both a dot plot (middle) and histogram (right). AU, arbitrary units; RFU, relative fluorescence units. (B) Relationship between RBC number and fALOD4 binding in three individuals with low (green), medium (blue) and high (orange) binding. Samples were collected on the same day and the fALOD4 binding assay was performed as described in the legend to Figure 1. Error bars represent the mean ± SEM of three measurements from each blood sample. The experiment was repeated once and the results were similar. (C) RBC cholesterol content and fALOD4 binding to RBCs. RBC ghost membranes were prepared from RBCs of 73 healthy, unrelated individuals. Total lipids were extracted from the membranes and the molar percentage of cholesterol was measured as described in the Materials and methods. fALOD4 binding values were normalized to the binding values obtained from the reference blood sample. Shown is the Spearman correlation between fALOD4 binding, normalized to the reference blood sample, and RBC membrane total cholesterol expressed as mole % of total lipids. Data points represent the means of three independent measurements of fALOD4 binding and a single measurement of RBC cholesterol content. The experiment was repeated once and the results were similar. nRFU, normalized relative fluorescence units.

