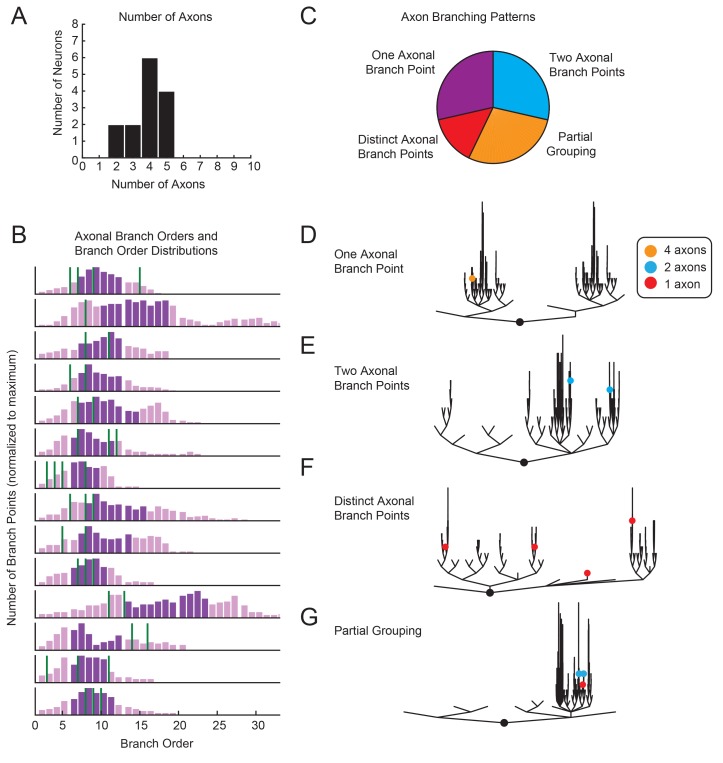
Figure 3. Variable axon location and branching patterns in GM neurons.
(A) Histogram shows the number of distinguishable axonal projections for 14 GM neurons. (B) Histograms show the distribution of branch orders across 14 GM neurons. Axonal branch point orders are indicated with green lines. Dark purple shading indicates the range between the 25th and 75th percentiles. For easy comparison across neurons, histograms were plotted with 100 bins and y axes were normalized to the maximum number of branch points given the 100 bins. (C) Pie chart summarizes axonal branching patterns across 14 GM neurons. (D–G) Examples of the different axonal branching pattern possibilities in C are illustrated with dendrograms of four GM neurons from the tested population. Axonal branch points are indicated with colored circles indicating the number of axons projected from that branch point: orange = 4 axons, blue = 2 axons, red = 1 axon.

