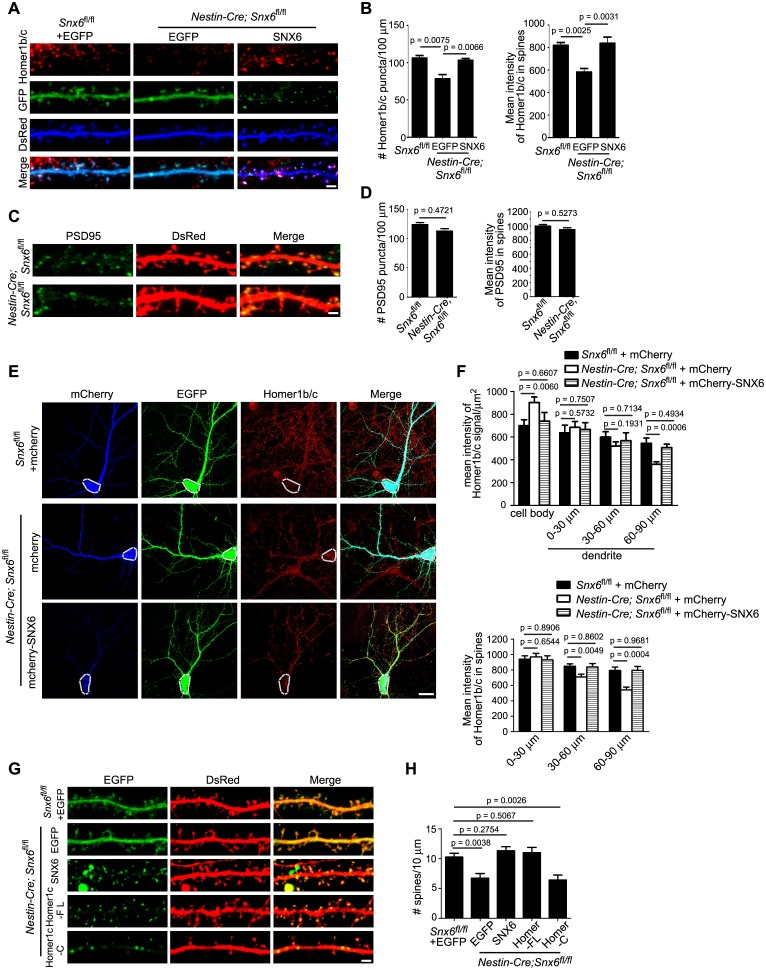
Figure 5. Partial loss of Homer1b/c from distal dendrites of Snx6-/- neurons.
(A) Neurons were co-transfected with pLL3.7.1 and EGFP or EGFP-SNX6 construct on DIV13, fixed on DIV18 and immunostained with antibodies to Homer1b/c. Shown are representative confocal images of dendritic segments. (B) Quantification of puncta number per 100 μm dendrite length and mean intensity in spines for Homer1b/c (mean ± SEM, n = 30, N = 3). (C) Neurons were transfected with pLL3.7.1 on DIV13, fixed on DIV18 and immunostained with antibodies to PSD95. (D) Quantification of PSD95 distribution in dendrites (mean ± SEM, n = 30, N = 3). (E) DIV14 neurons were co-transfected with constructs overexpressing EGFP and mCherry or mCherry-SNX6, fixed on DIV16 and immunostained with antibodies to Homer1b/c. shown are representative confocal images of transfected neurons. Dashed lines outline the cell bodies. (F) Quantification of Homer1b/c distribution in the cell body and dendrites, and its mean intensity in spines in (E) (mean ± SEM, n = 30, N = 3). (G) DIV13 neurons were co-transfected with constructs expressing DsRed and EGFP, EGFP-SNX6, mEmerald-Homer1c-FL or EGFP-Homer1c-C and fixed on DIV18. (H) Quantification of spine density in (G) (mean ± SEM, n = 30, N = 3). Bars: 20 μm in (E), 2 μm in other panels.


