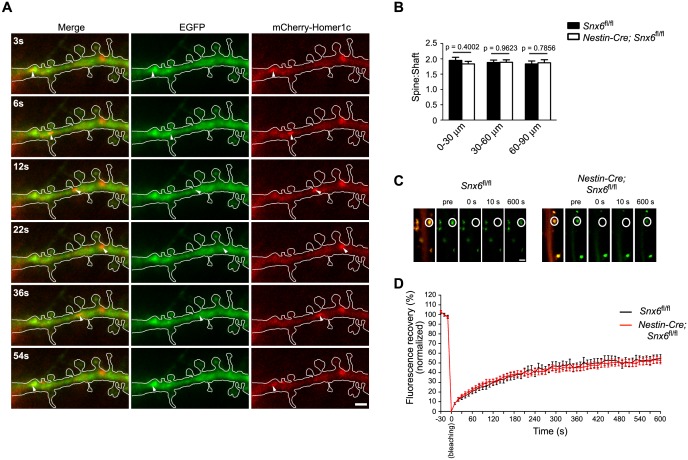
Figure 8. Homer1b/c enters spines by SNX6-independent protein diffusion.
(A) Representative images from a time-lapse video (Video 13) of a wild-type neuron co-expressing EGFP and mCherry-Homer1c. White solid lines indicate outline of the dendritic shaft and spines. White arrowheads indicate positions of a Homer1c-labeled structure moving in the shaft. Bar: 2 μm. (B) Spine:shaft ratios of Homer1b/c fluorescence intensity over distance from the cell body. DIV14 neurons from Snx6fl/fl and Nestin-Cre; Snx6fl/fl mice were transfected with construct overexpressing EGFP as volume marker, fixed on DIV16 and immunostained with antibodies to Homer1b/c. Shown are the ratios of the mean intensity of Homer1b/c in spines to that in the corresponding shaft (mean ± SEM, 50 spines from 15 neurons/group, N = 2 independent experiments). (C) FRAP analysis of mEmerald-Homer1c in dendritic spines. Hippocampal neurons were co-transfected with constructs expressing mEmerald-Homer1c and DsRed on DIV13. FRAP analysis was performed on DIV16. Shown are examples of the fluorescence intensity of mEmerald-Homer1c before, immediately after, 10 s and 600 s after photobleaching of the spines indicated with white circles. Bar: 1 μm. (D) Averaged fluorescence recovery curves after photobleaching for mEmerald-Homer1c in spines of Snx6+/+ (31 spines, 10 cells) and Snx6-/- (32 spines, 10 cells) neurons. Data represent mean ± SEM.

