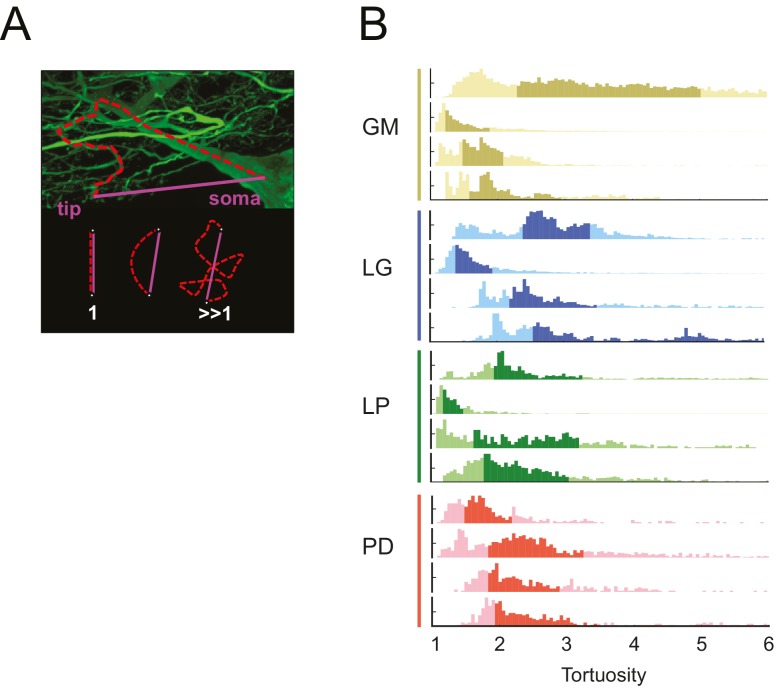
Figure 10. STG neurons have tortuous neurite paths.
Tortuosities were calculated for every soma-to-tip neurite path detected from the three-dimensional skeletal reconstruction of each neuron (N = 16). (A) An example neurite path (red dashed line) from soma to terminal tip is shown on maximum projection image of an STG neuron section. The tortuosity of such a path is calculated as the ratio of the actual path length (red) over the Euclidean distance from soma to tip (purple). If the actual neurite path follows the most efficient Euclidean path, it will have a tortuosity of 1. If the neurite path deviates from this minimal path, its tortuosity will be >1. (B) Histograms of tortuosities for all neurite paths within each neuron (gold = GM neuron, blue = LG neuron, green = LP neuron, red = PD neuron). Darker shaded regions indicate 25–75% confidence intervals. In all cases, the distributions spanning tortuosities between 1 and 6 are shown (x-axis). In some cases, the distributions extend beyond values of 6 (not shown in this figure).

