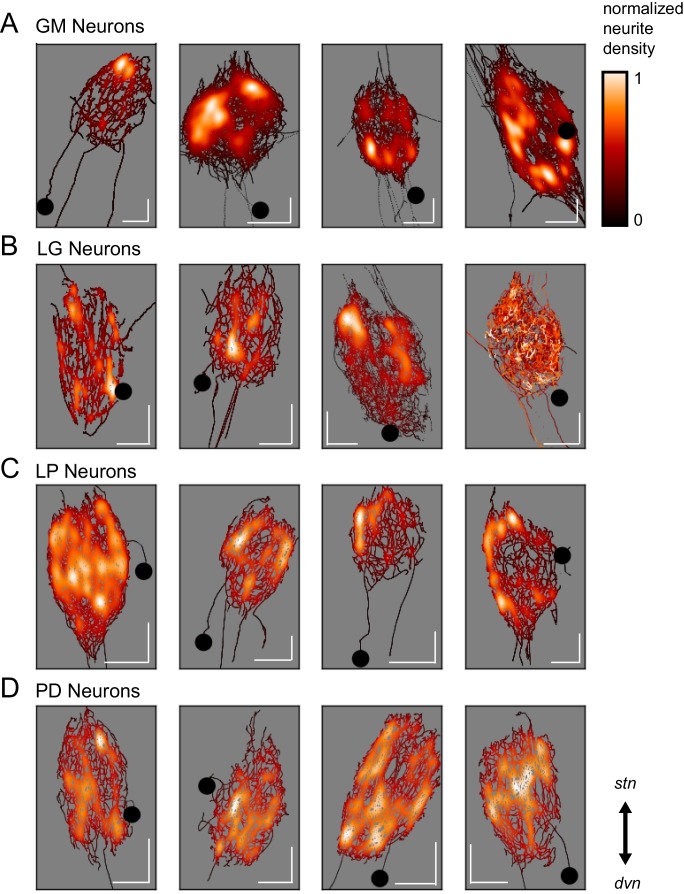
Figure 3. Variable spatial density profiles within and across neuron types.
Spatial density profiles were generated using Gaussian kernel density estimation in the x and y dimensions. This calculation generated a probability distribution function for the points composing each skeletal reconstruction. The black-red-white color map is scaled within each neuron (see Materials and methods) and represents relative neurite density.White values indicate areas of high neurite density and black values indicate areas of low neurite density. White scale bars = 100 µm; black circles indicate somata locations. Each plot is oriented such that the stn is projecting upward and the dvn is projecting downward (as indicated).

